 7
7peptides
spectra
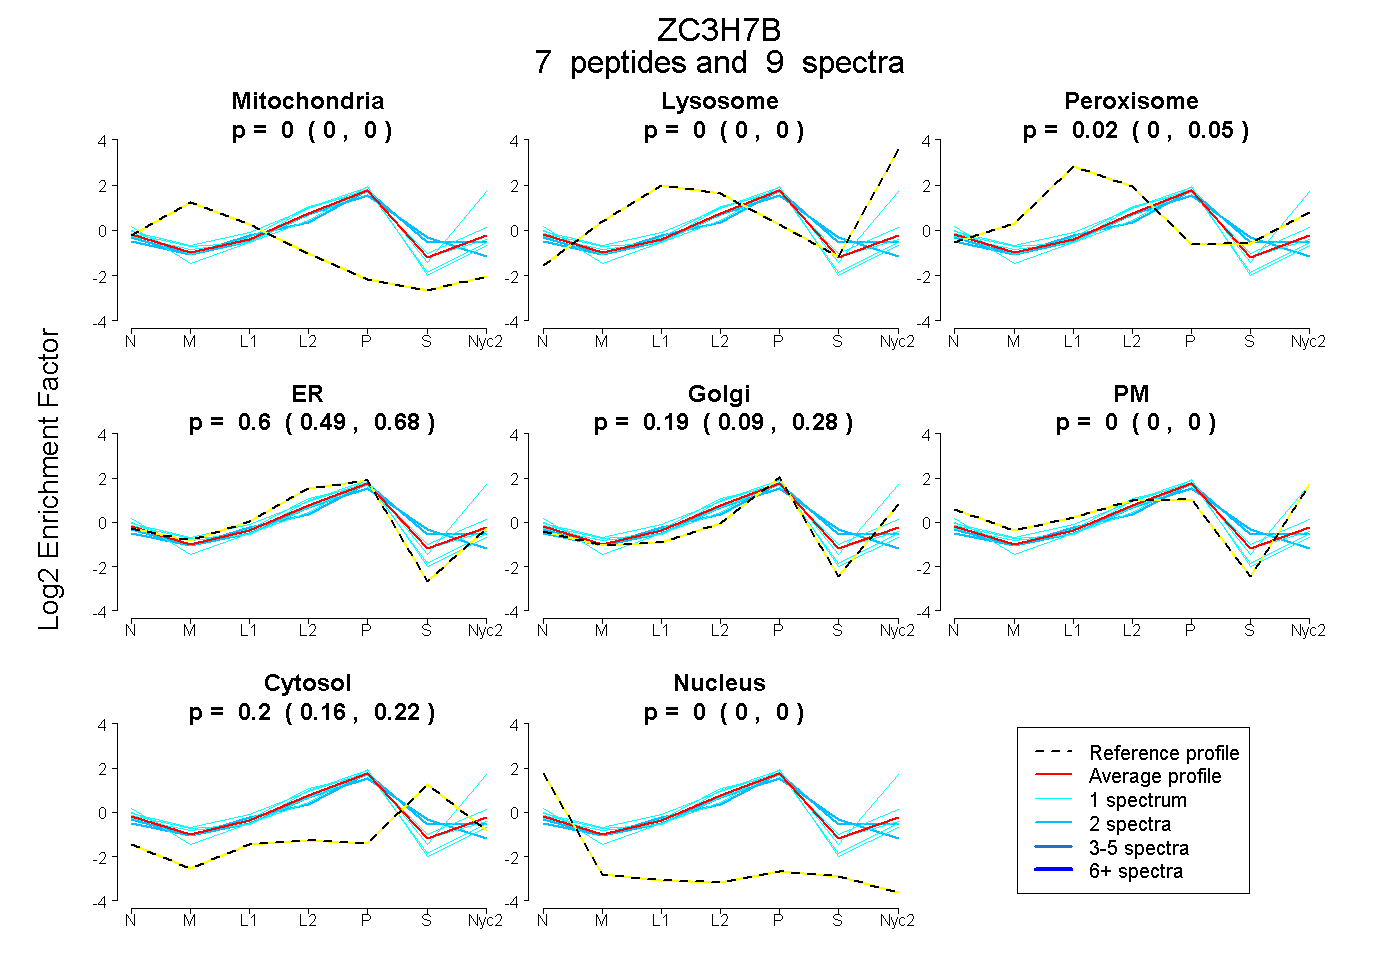
0.000 | 0.000
0.000 | 0.000
0.000 | 0.047
0.486 | 0.678
0.095 | 0.276
0.000 | 0.000
0.164 | 0.218
0.000 | 0.000
2peptides
spectra
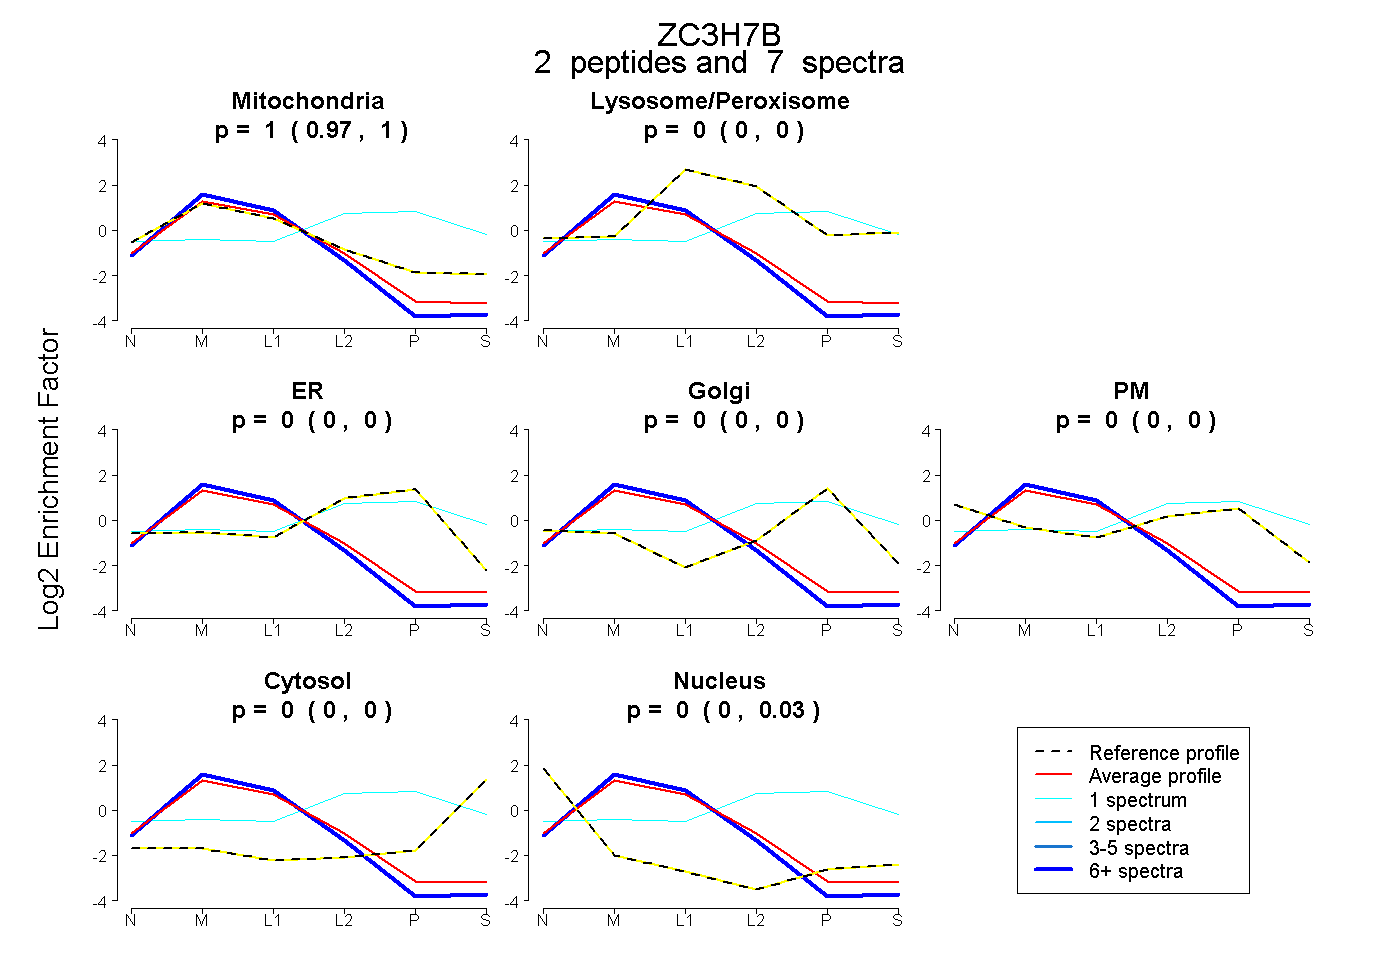
0.968 | 1.000
0.000 | 0.000
0.000 | 0.000
0.000 | 0.000
0.000 | 0.000
0.000 | 0.000
0.000 | 0.027
5peptides
spectra

0.000 | 0.000
1.000 | 1.000
1peptide
spectrum
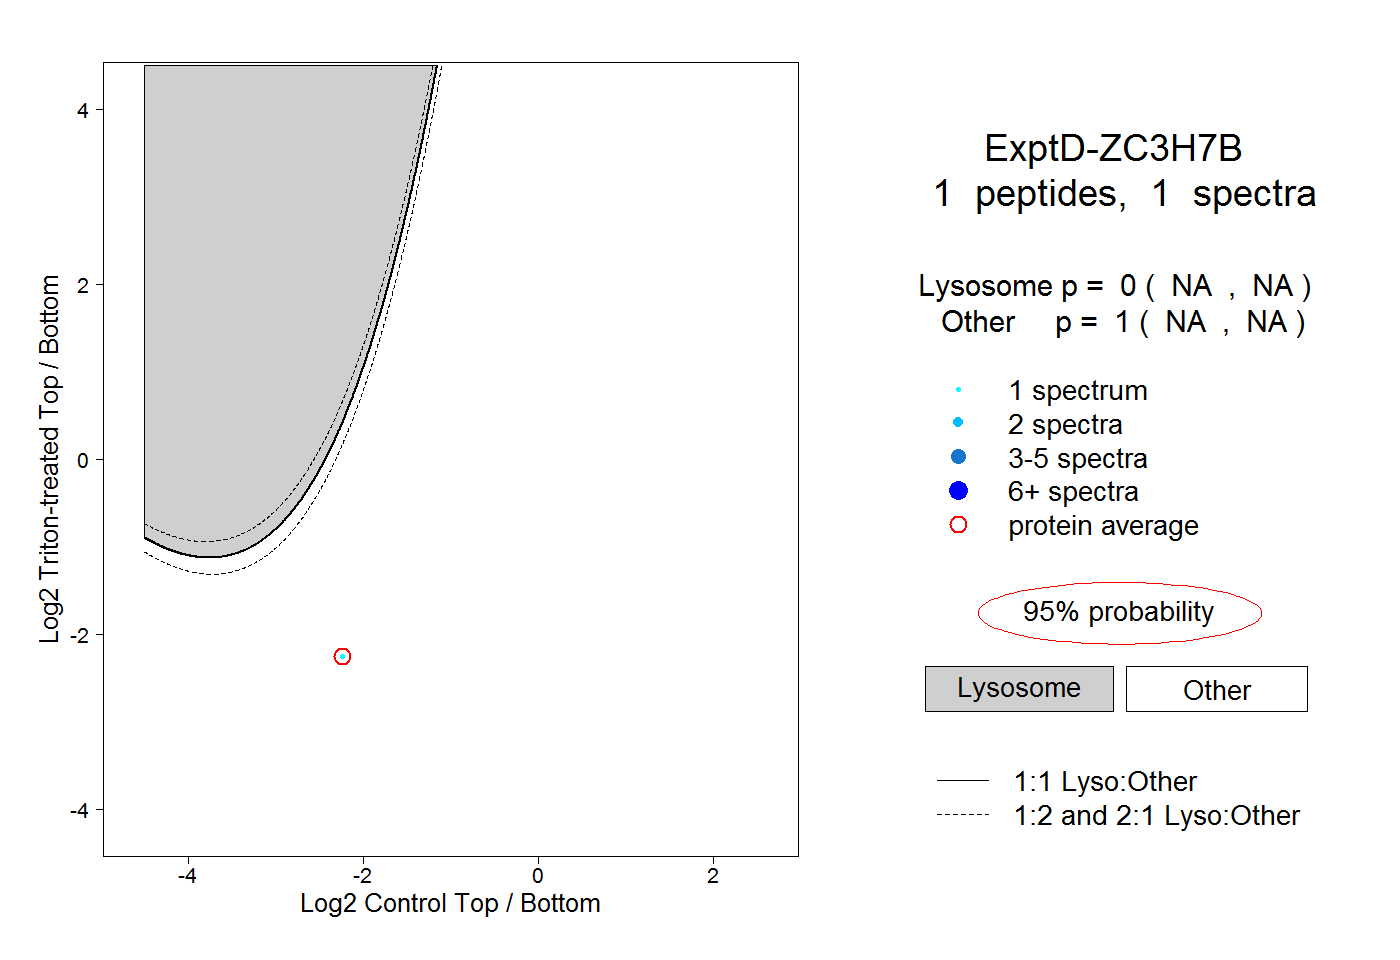
NA | NA
NA | NA