 7
7peptides
spectra
0.000 | 0.000
0.000 | 0.000
0.000 | 0.047
0.486 | 0.678
0.095 | 0.276
0.000 | 0.000
0.164 | 0.218
0.000 | 0.000
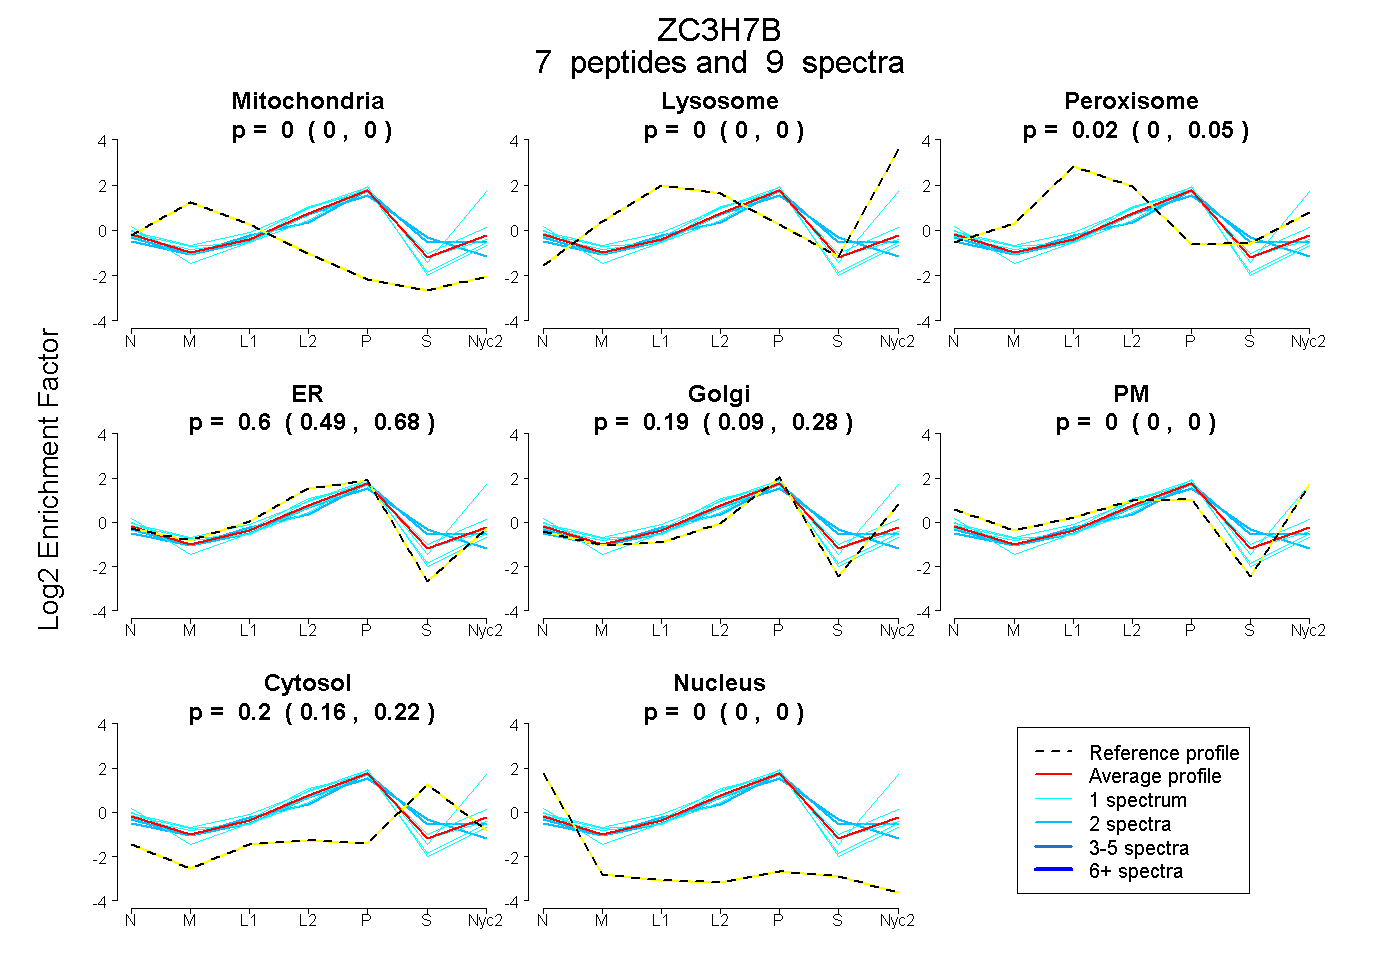
| Plot | Mito | Lyso | Perox | ER | Golgi | PM | Cytosol | Nucleus | |||||
| Expt A |
7 peptides |
9 spectra |
|
0.000 0.000 | 0.000 |
0.000 0.000 | 0.000 |
0.018 0.000 | 0.047 |
0.600 0.486 | 0.678 |
0.188 0.095 | 0.276 |
0.000 0.000 | 0.000 |
0.195 0.164 | 0.218 |
0.000 0.000 | 0.000 |
| 1 spectrum, FVCGQCWR | 0.000 | 0.202 | 0.000 | 0.008 | 0.597 | 0.170 | 0.023 | 0.000 | ||
| 1 spectrum, DSPSVCSNLAAK | 0.025 | 0.000 | 0.004 | 0.811 | 0.060 | 0.000 | 0.101 | 0.000 | ||
| 2 spectra, CLVHIVR | 0.000 | 0.000 | 0.000 | 0.645 | 0.000 | 0.000 | 0.355 | 0.000 | ||
| 1 spectrum, EGLEHK | 0.000 | 0.000 | 0.012 | 0.565 | 0.038 | 0.185 | 0.200 | 0.000 | ||
| 1 spectrum, LDALDSFGSAR | 0.000 | 0.000 | 0.000 | 0.603 | 0.246 | 0.000 | 0.063 | 0.087 | ||
| 1 spectrum, DLLFDPLGGVK | 0.000 | 0.000 | 0.000 | 0.634 | 0.161 | 0.000 | 0.205 | 0.000 | ||
| 2 spectra, AGDYTYR | 0.000 | 0.000 | 0.032 | 0.545 | 0.124 | 0.000 | 0.299 | 0.000 |
| Plot | Mito | Lyso or Perox | ER | Golgi | PM | Cytosol | Nucleus | ||||||
| Expt B |
2 peptides |
7 spectra |
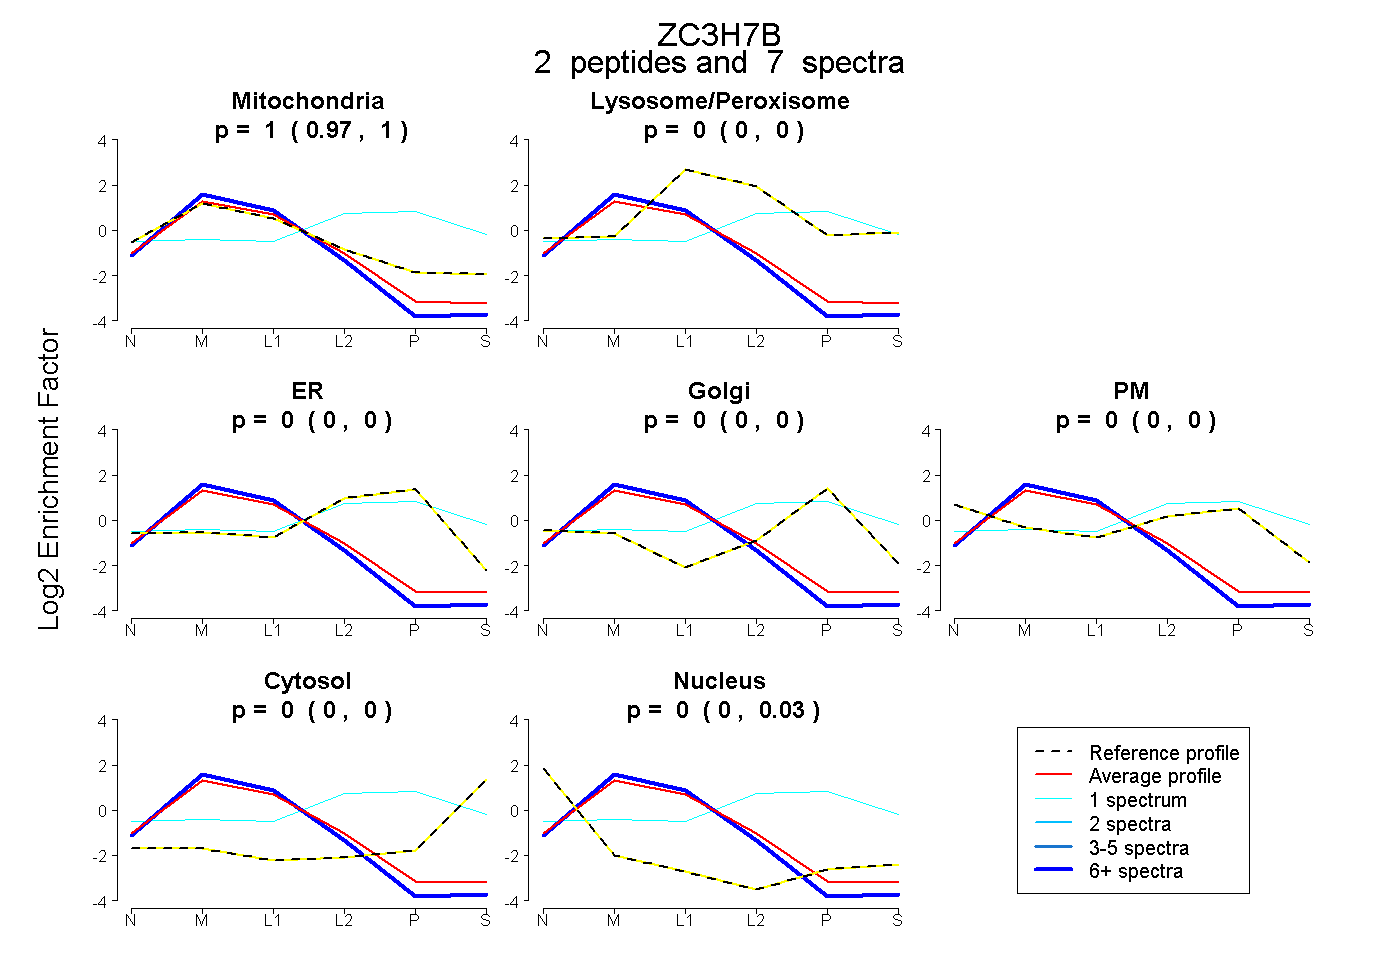 |
0.999 0.968 | 1.000 |
0.000 0.000 | 0.000 |
0.000 0.000 | 0.000 |
0.000 0.000 | 0.000 |
0.000 0.000 | 0.000 |
0.000 0.000 | 0.000 |
0.001 0.000 | 0.027 |
|||
| Plot | Lyso | Other | |||||||||||
| Expt C |
5 peptides |
6 spectra |
 |
0.000 0.000 | 0.000 |
1.000 1.000 | 1.000 |
||||||||
| Plot | Lyso | Other | |||||||||||
| Expt D |
1 peptide |
1 spectrum |
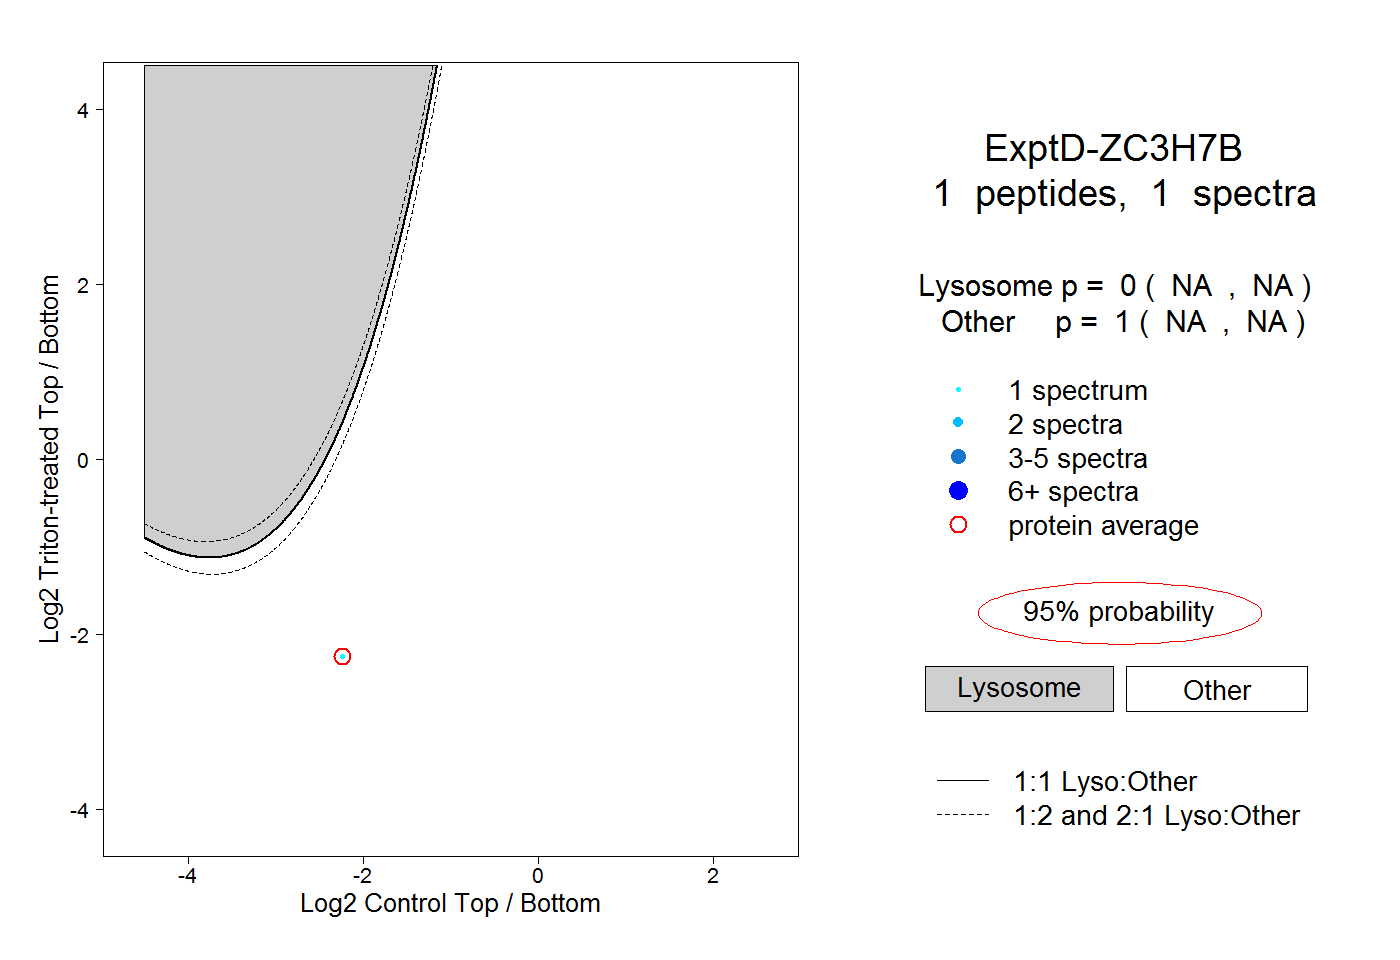 |
0.000 NA | NA |
1.000 NA | NA |