 23
23peptides
spectra
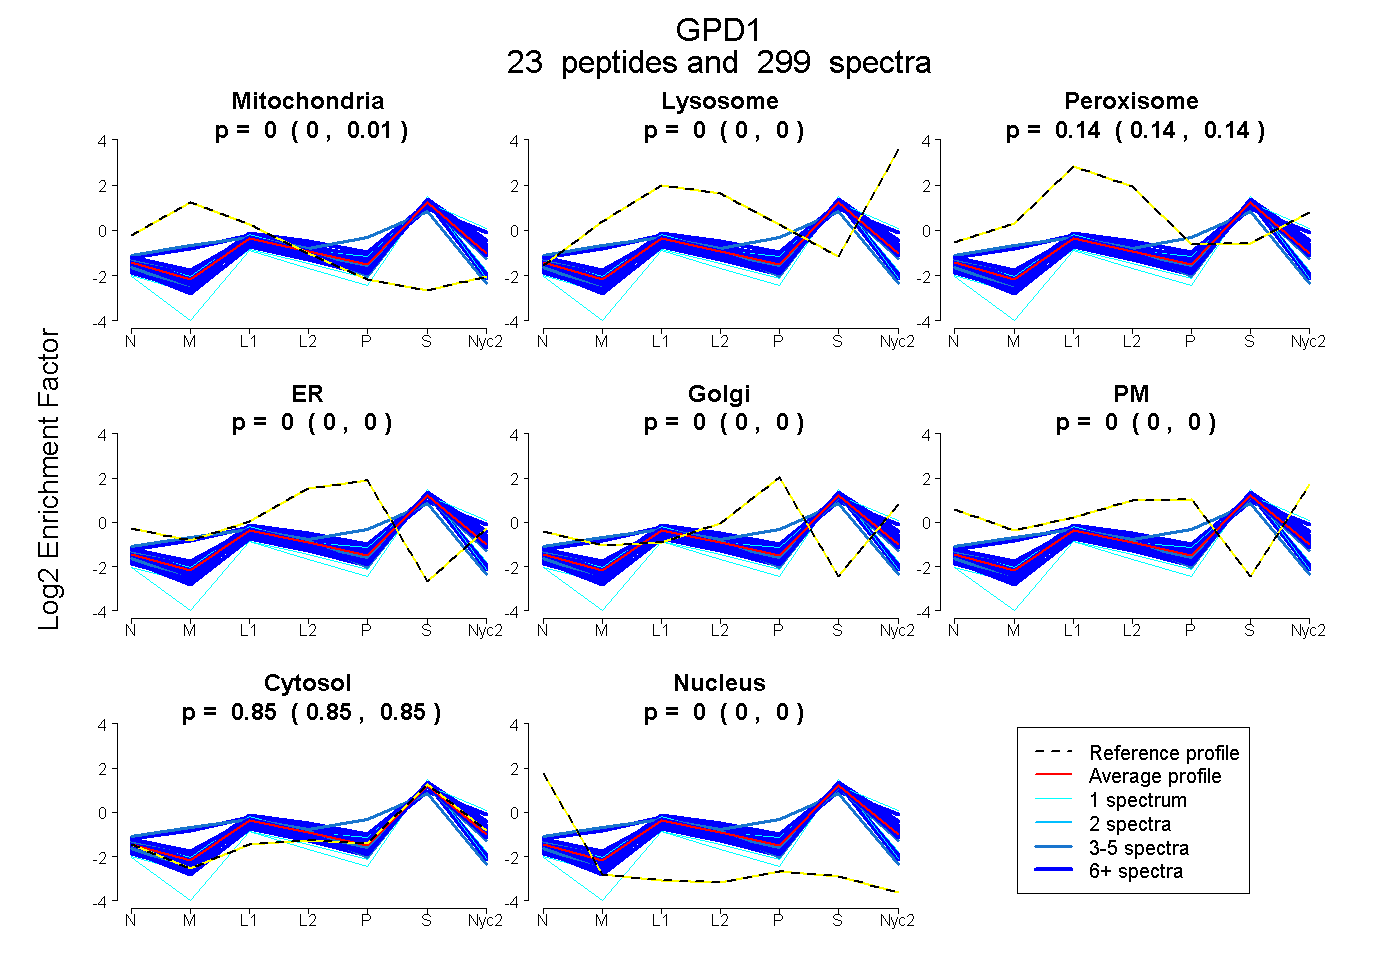
0.003 | 0.006
0.000 | 0.000
0.140 | 0.143
0.000 | 0.000
0.000 | 0.000
0.000 | 0.000
0.852 | 0.855
0.000 | 0.000
16peptides
spectra
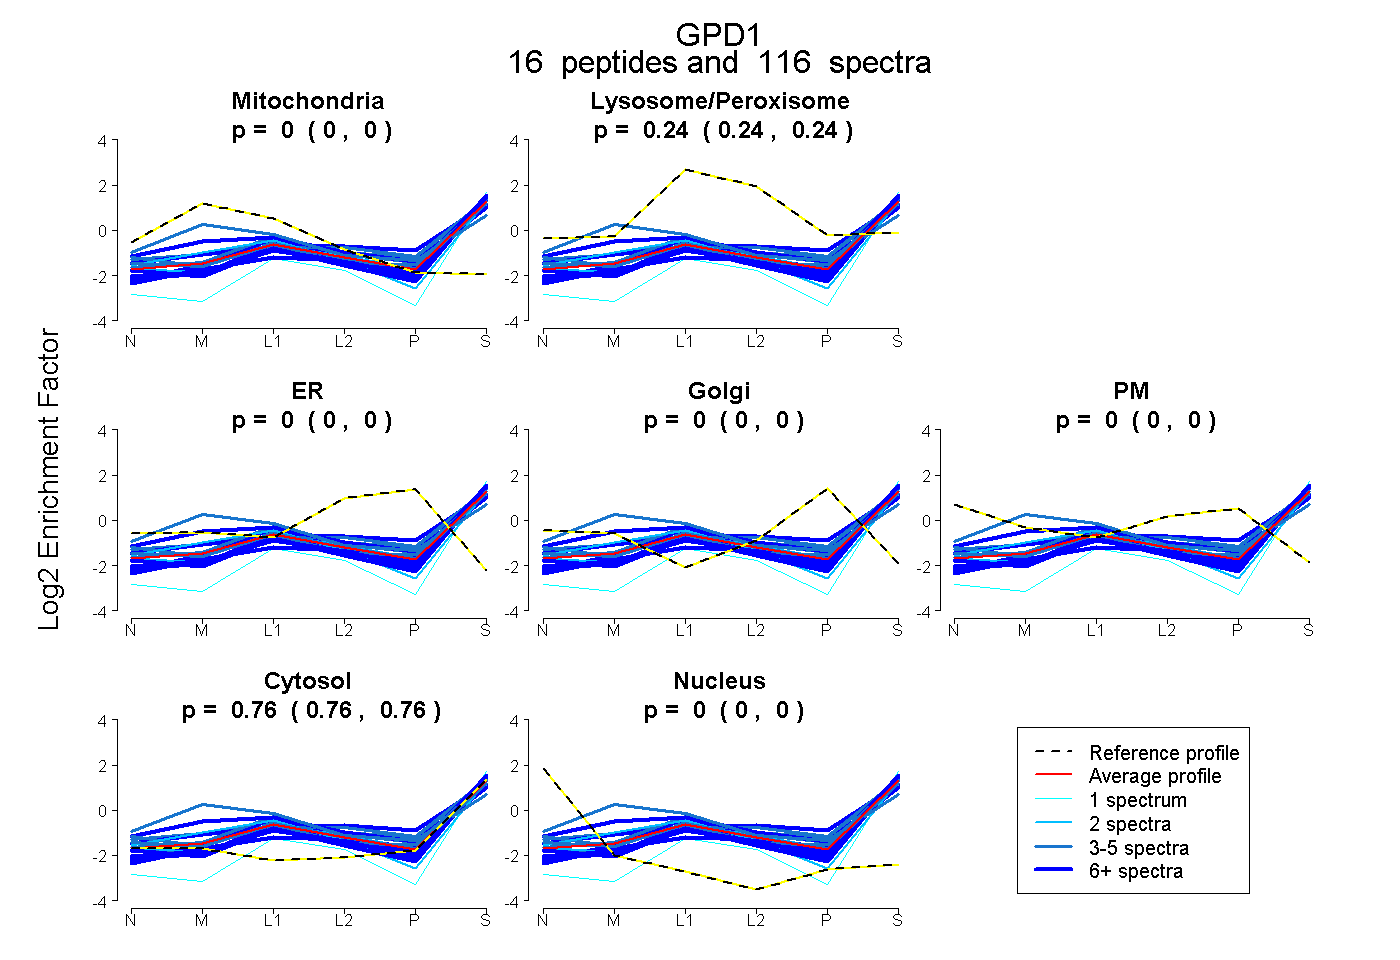
0.000 | 0.000
0.240 | 0.244
0.000 | 0.000
0.000 | 0.000
0.000 | 0.000
0.756 | 0.760
0.000 | 0.000
22peptides
spectra
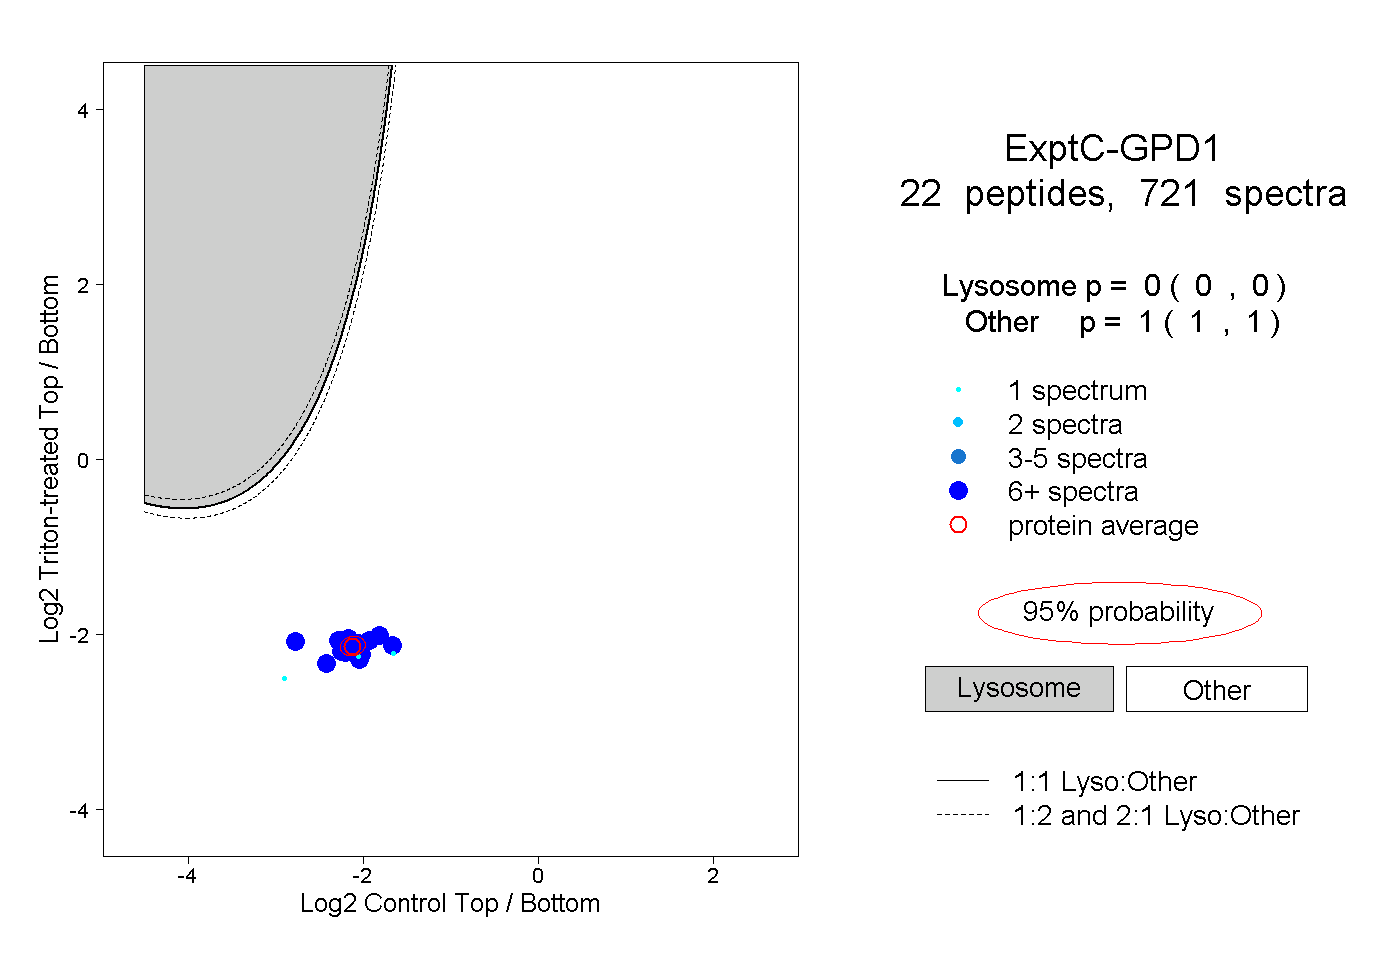
0.000 | 0.000
1.000 | 1.000
14peptides
spectra
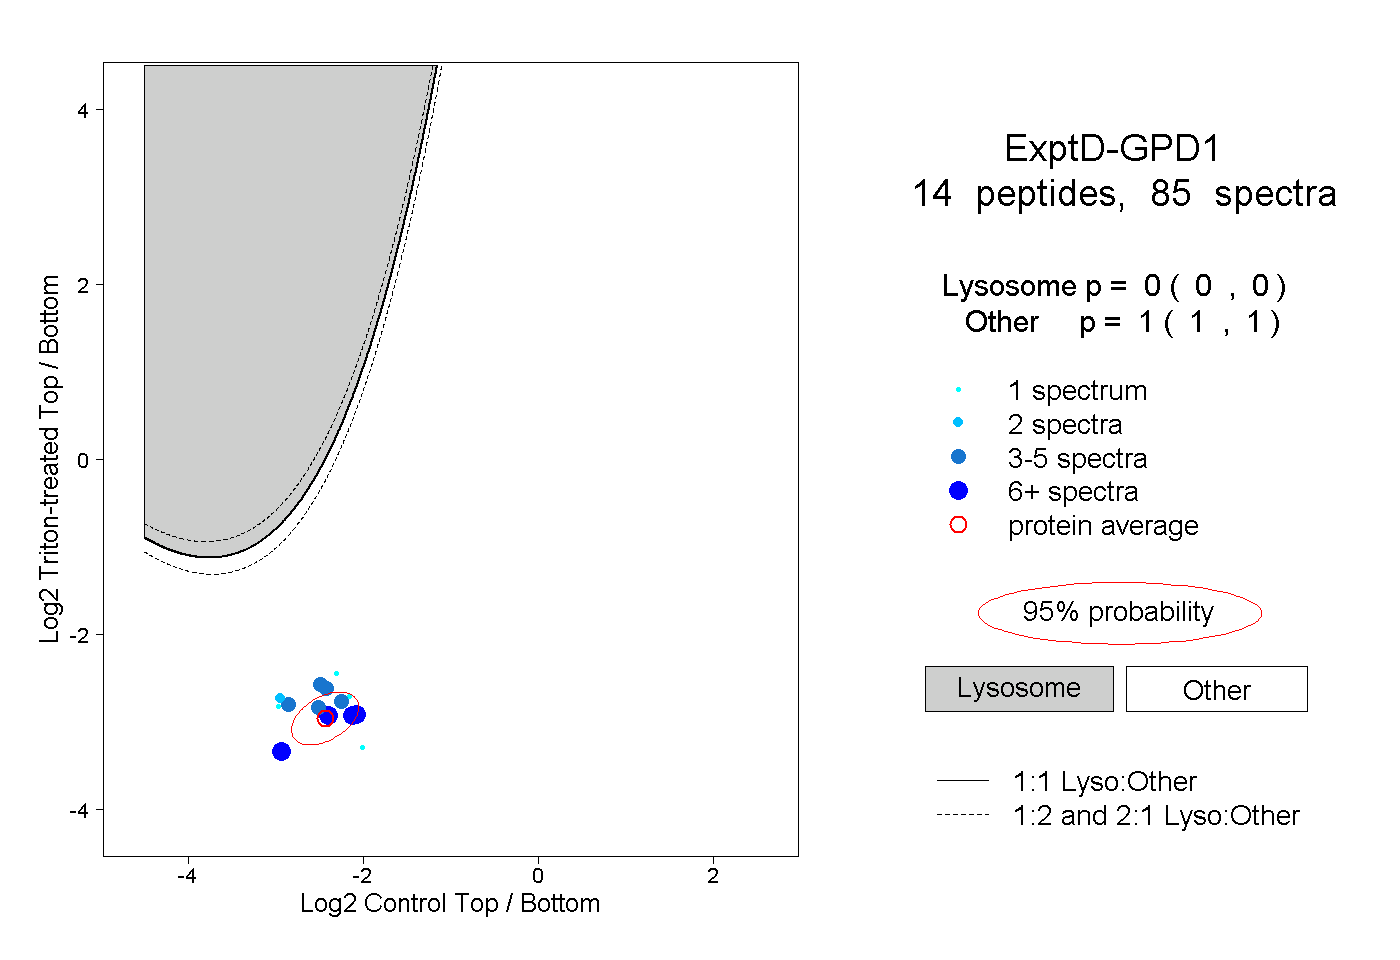
0.000 | 0.000
1.000 | 1.000