 3
3peptides
spectra
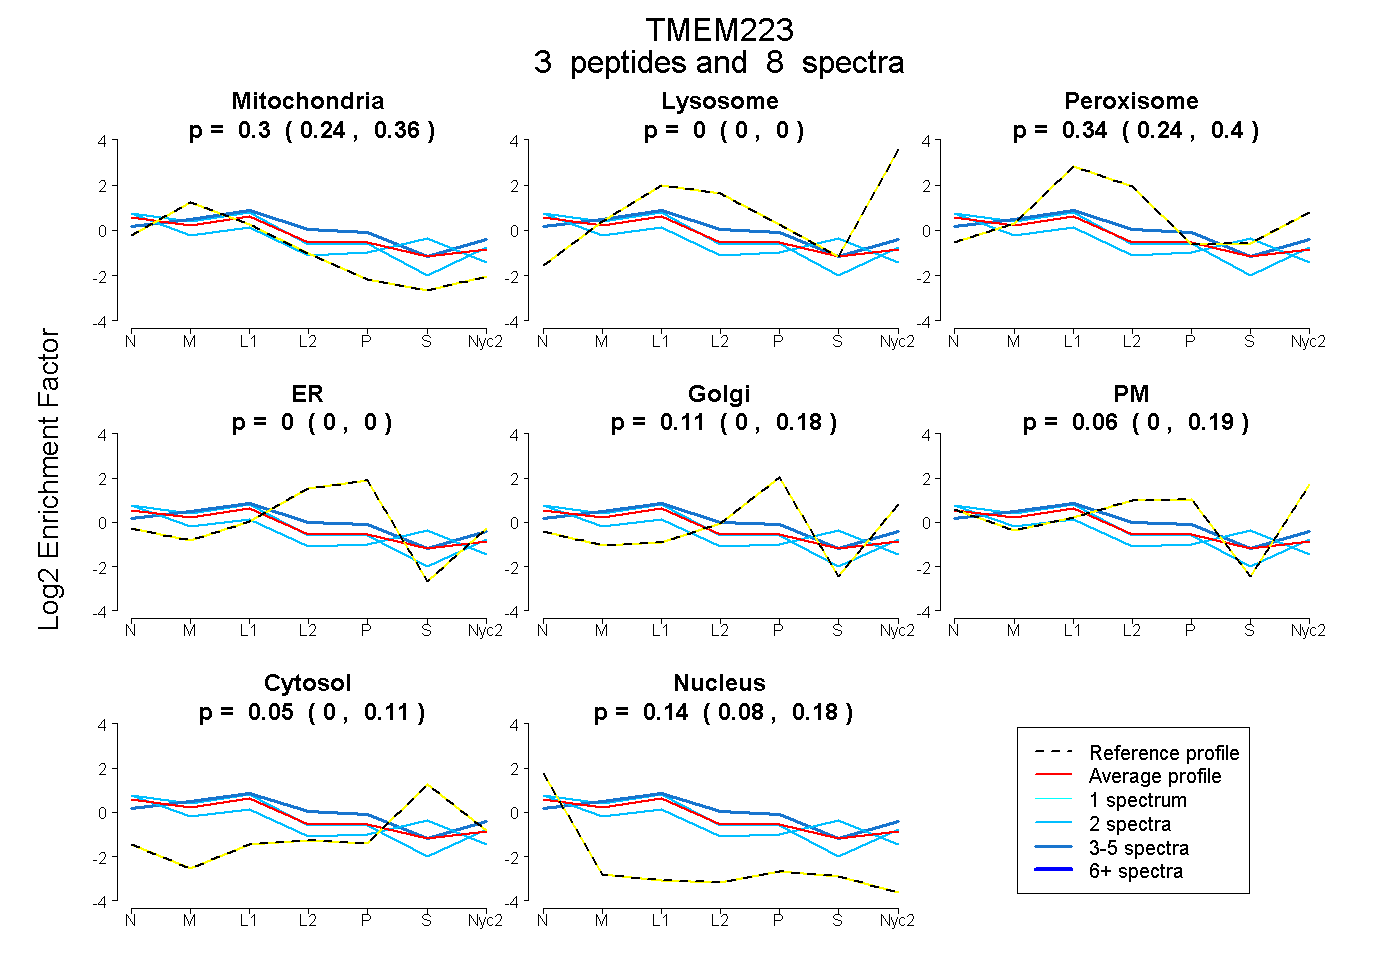
0.243 | 0.360
0.000 | 0.000
0.243 | 0.405
0.000 | 0.000
0.000 | 0.181
0.000 | 0.190
0.000 | 0.110
0.079 | 0.175
4peptides
spectra
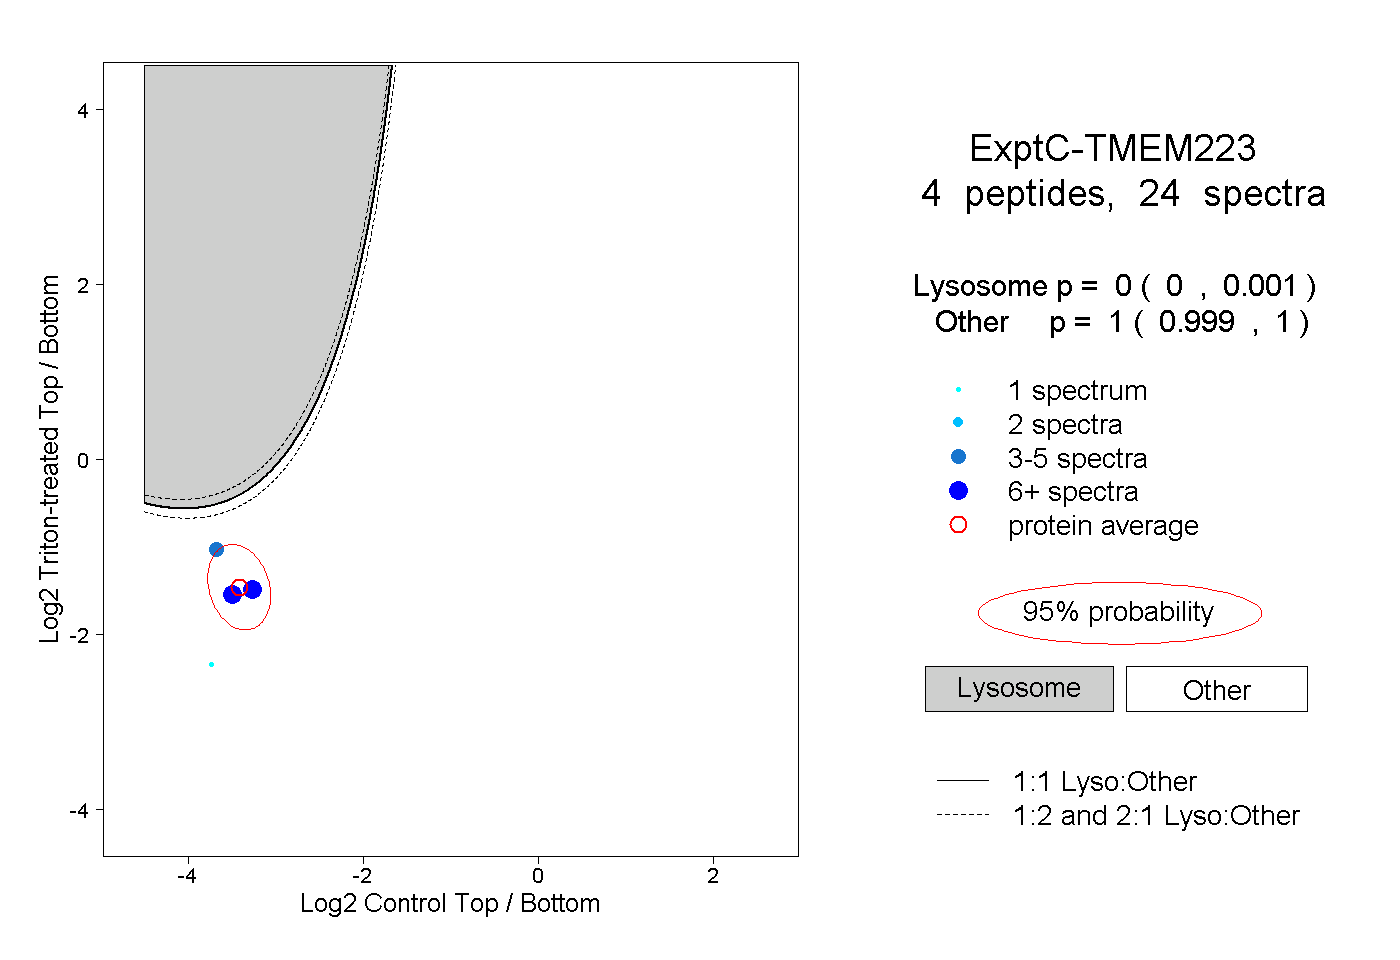
0.000 | 0.001
0.999 | 1.000
1peptide
spectra
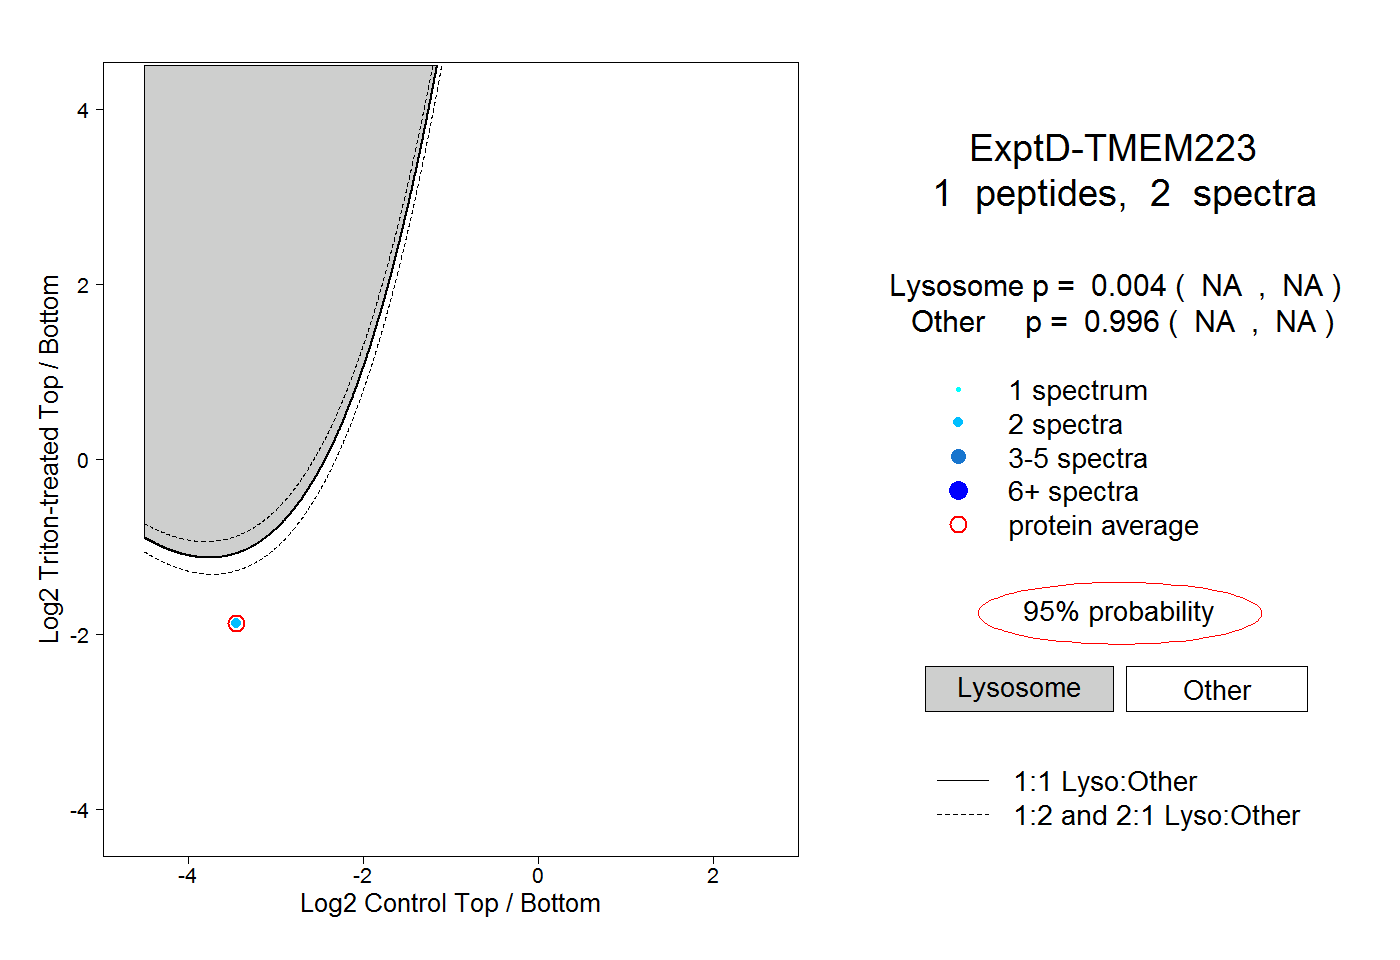
NA | NA
NA | NA