 3
3peptides
spectra
0.243 | 0.360
0.000 | 0.000
0.243 | 0.405
0.000 | 0.000
0.000 | 0.181
0.000 | 0.190
0.000 | 0.110
0.079 | 0.175
| Plot | Mito | Lyso | Perox | ER | Golgi | PM | Cytosol | Nucleus | |||||
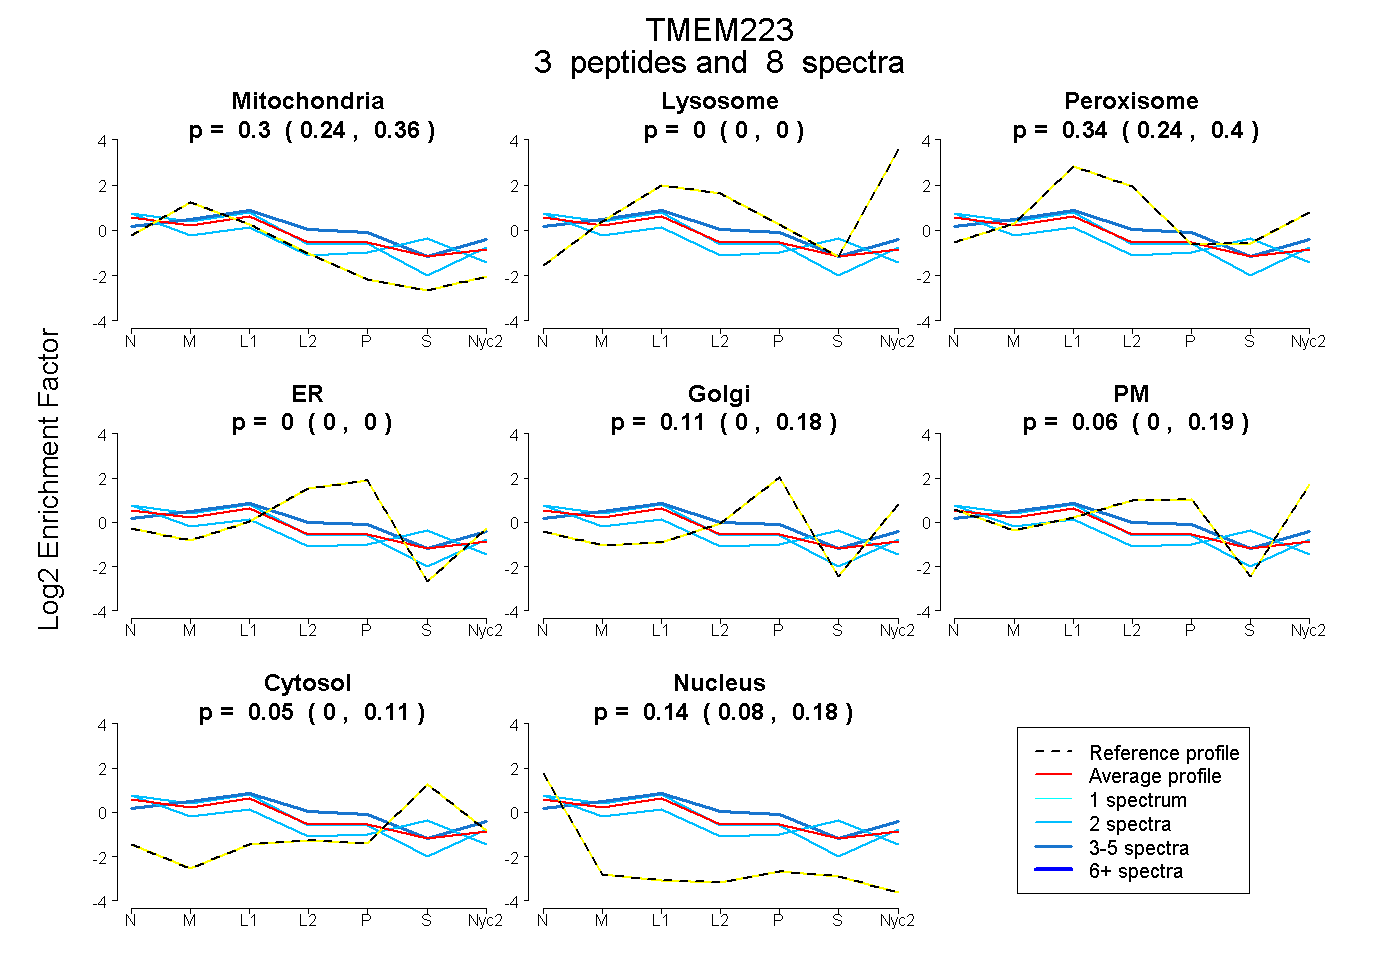
| Expt A |
3 peptides |
8 spectra |
|
0.301 0.243 | 0.360 |
0.000 0.000 | 0.000 |
0.342 0.243 | 0.405 |
0.000 0.000 | 0.000 |
0.111 0.000 | 0.181 |
0.060 0.000 | 0.190 |
0.048 0.000 | 0.110 |
0.138 0.079 | 0.175 |
| 2 spectra, AGHFPNTLLFDNTVGTYR | 0.427 | 0.000 | 0.184 | 0.000 | 0.000 | 0.286 | 0.000 | 0.102 | ||
| 4 spectra, DVLLFEHER | 0.320 | 0.000 | 0.368 | 0.000 | 0.241 | 0.018 | 0.038 | 0.015 | ||
| 2 spectra, VPAEAPNR | 0.231 | 0.000 | 0.332 | 0.000 | 0.000 | 0.000 | 0.215 | 0.222 |
| Plot | Lyso | Other | |||||||||||
| Expt C |
4 peptides |
24 spectra |
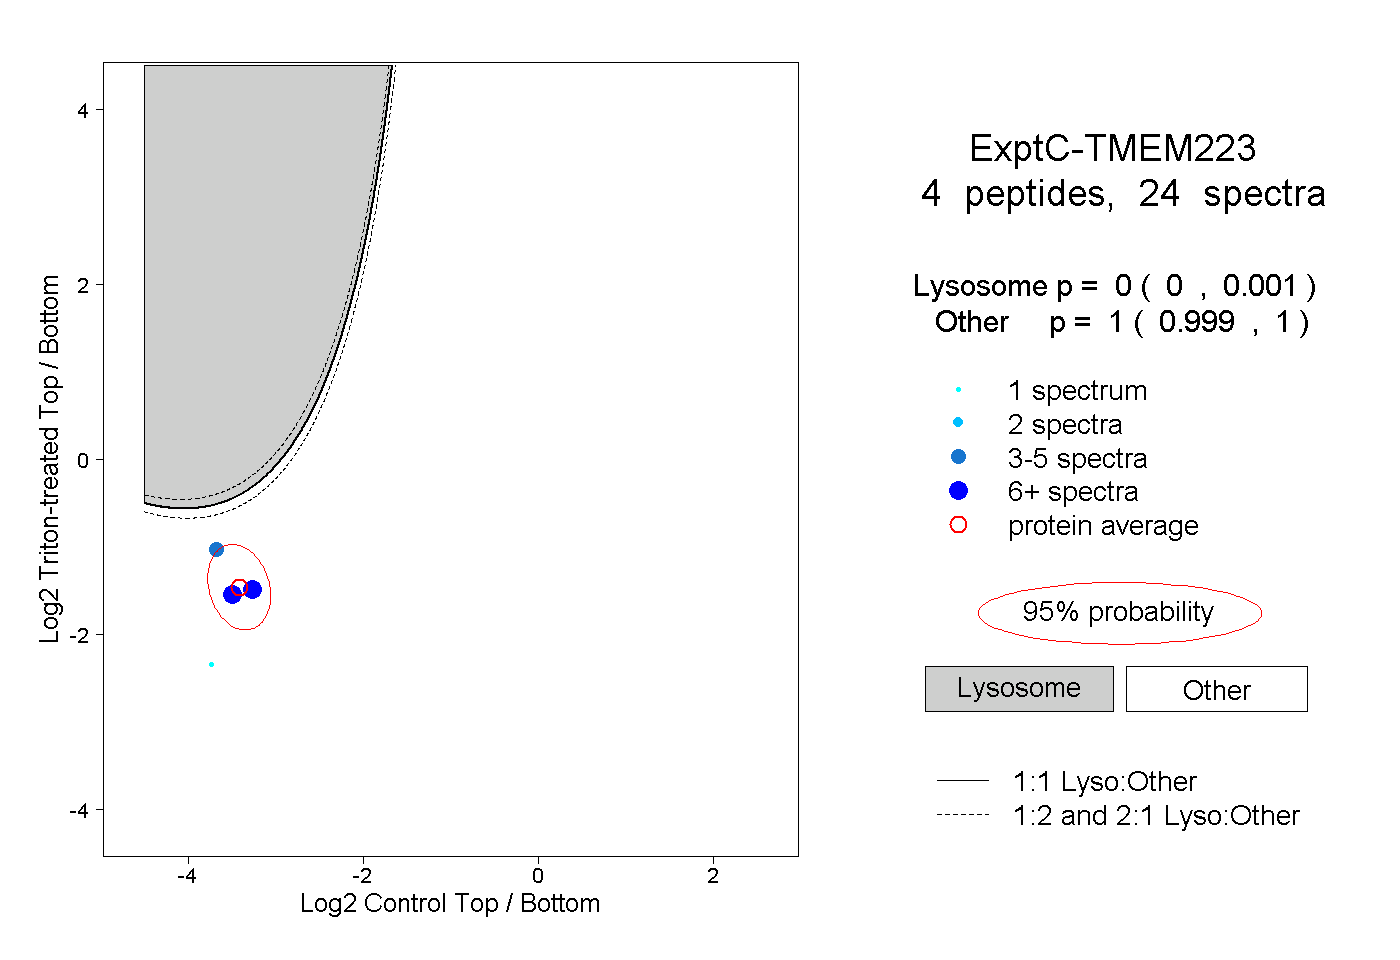 |
0.000 0.000 | 0.001 |
1.000 0.999 | 1.000 |
||||||||
| Plot | Lyso | Other | |||||||||||
| Expt D |
1 peptide |
2 spectra |
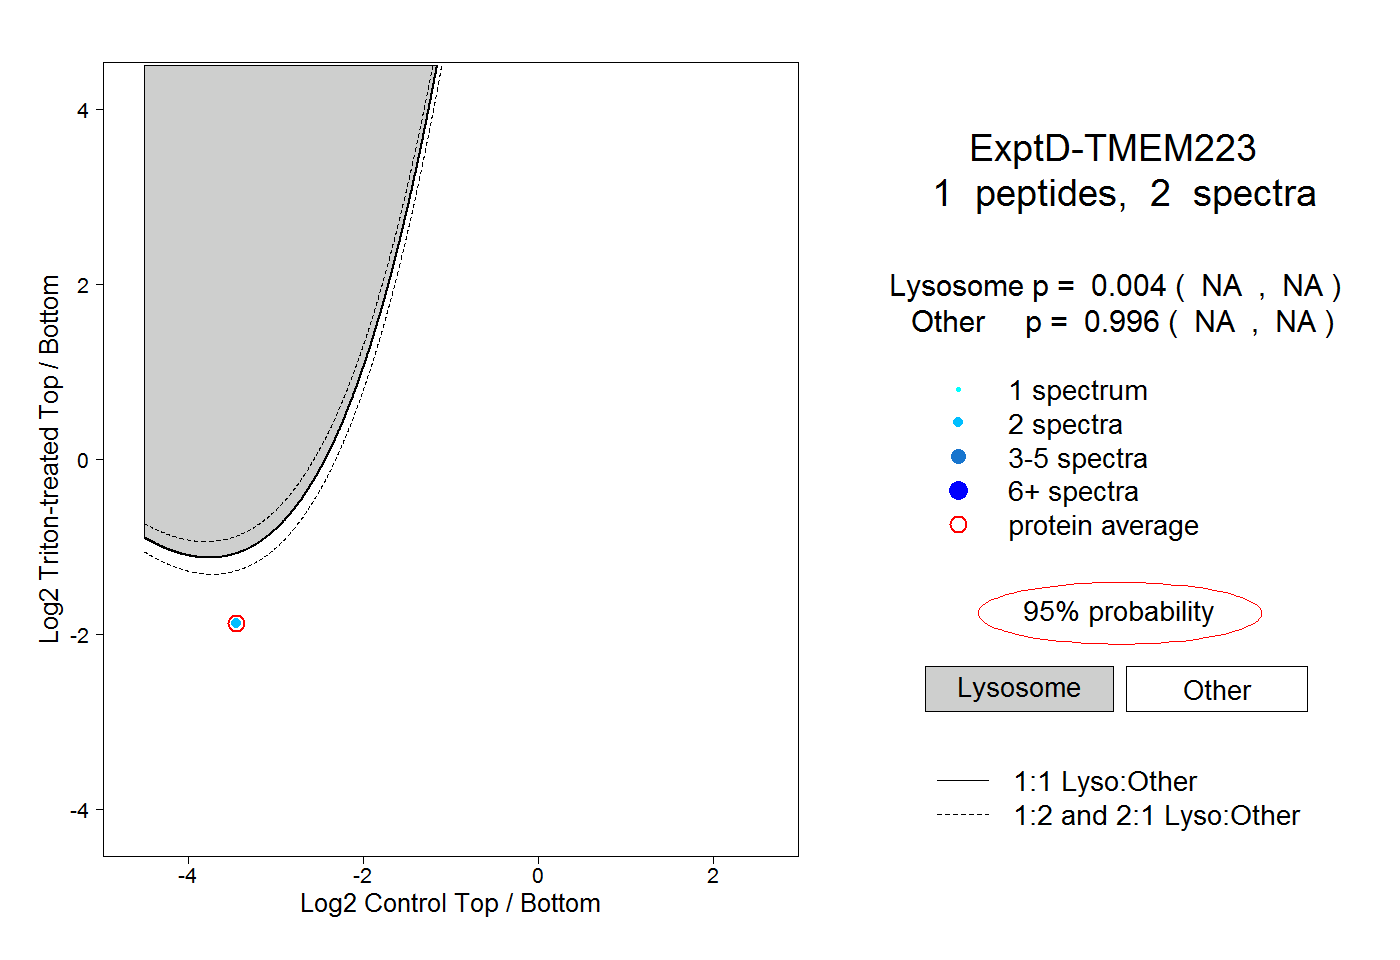 |
0.004 NA | NA |
0.996 NA | NA |