 22
22peptides
spectra
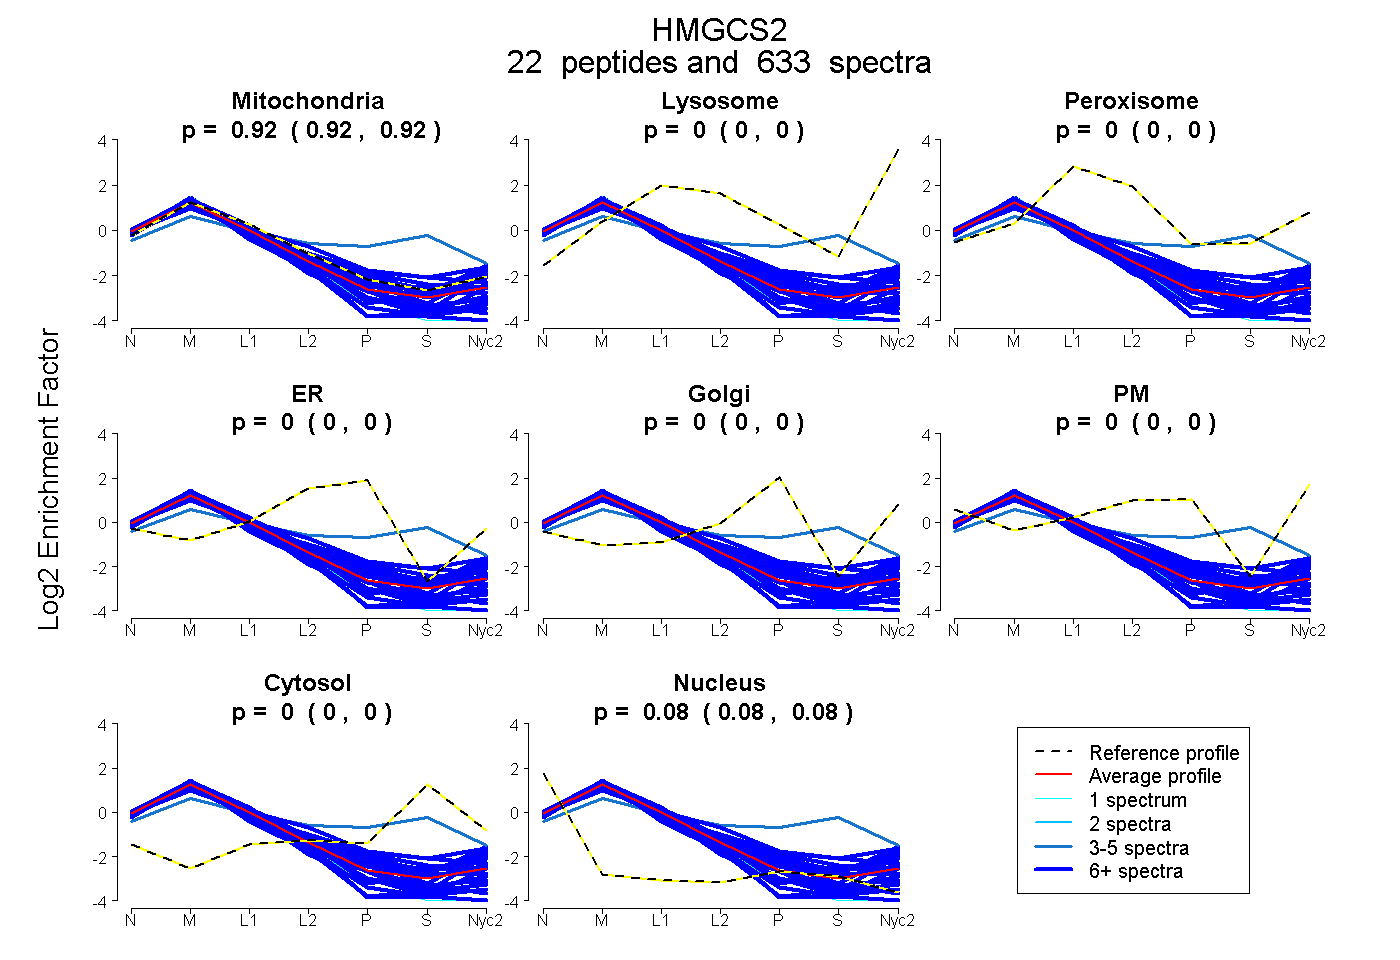
0.918 | 0.919
0.000 | 0.000
0.000 | 0.000
0.000 | 0.000
0.000 | 0.000
0.000 | 0.000
0.000 | 0.000
0.081 | 0.082
20peptides
spectra
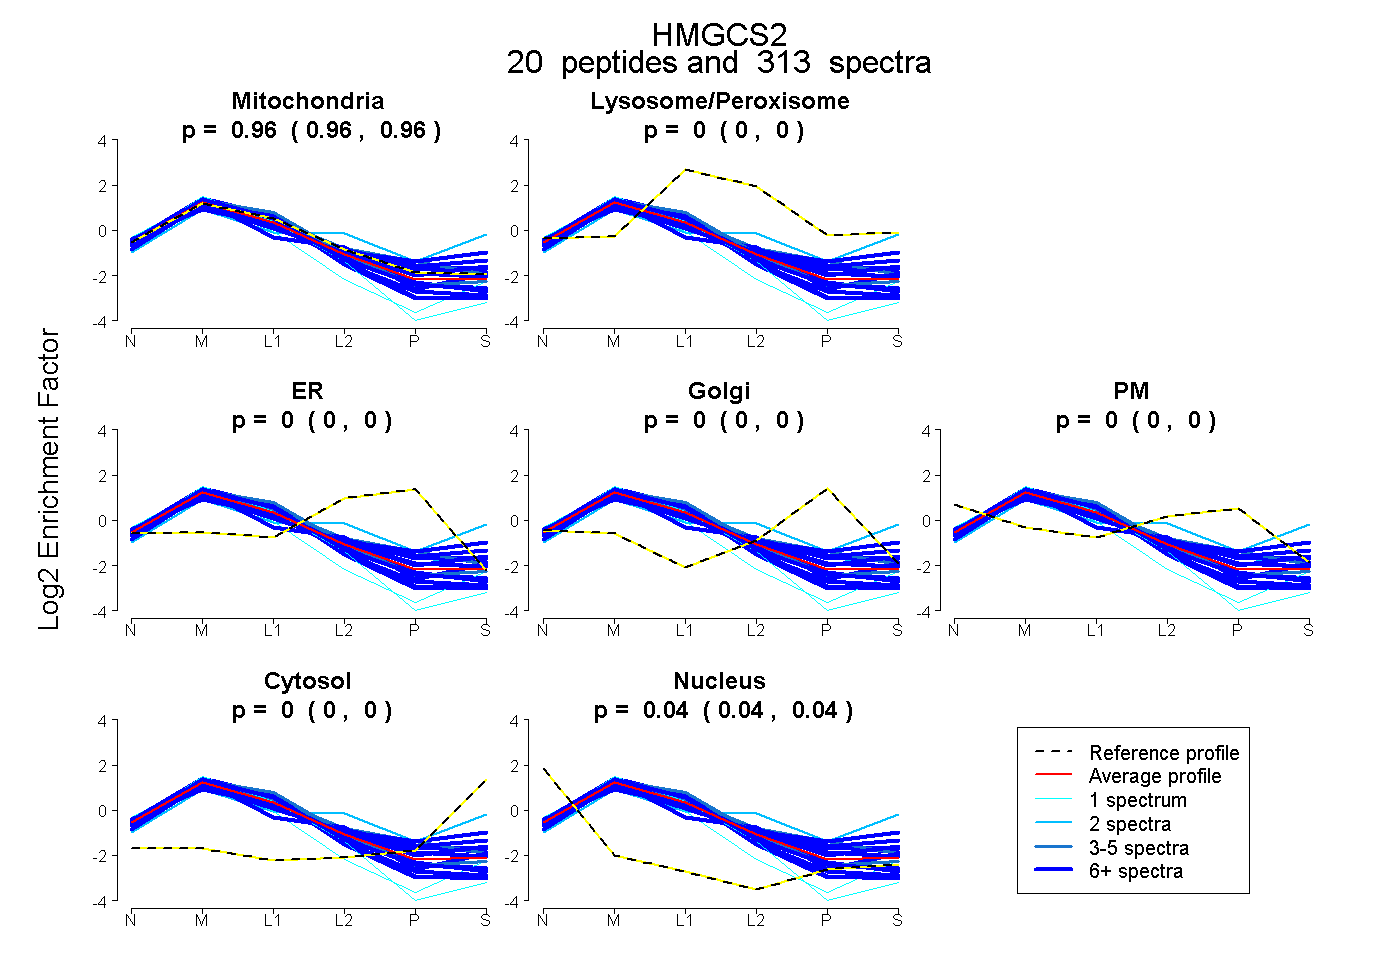
0.960 | 0.962
0.000 | 0.000
0.000 | 0.000
0.000 | 0.000
0.000 | 0.000
0.000 | 0.000
0.038 | 0.040
25peptides
spectra
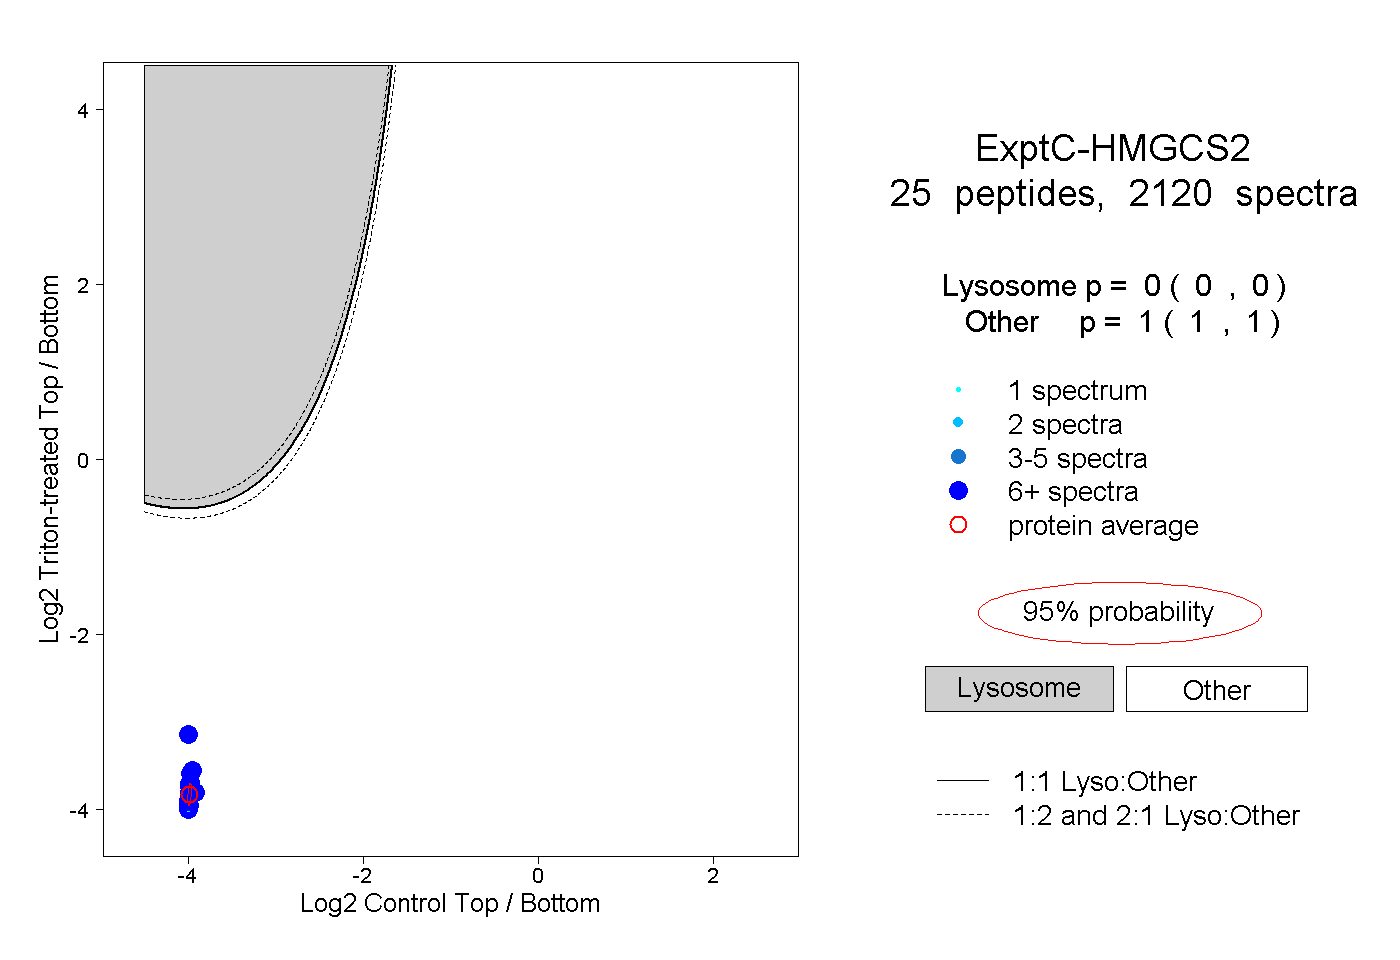
0.000 | 0.000
1.000 | 1.000
18peptides
spectra
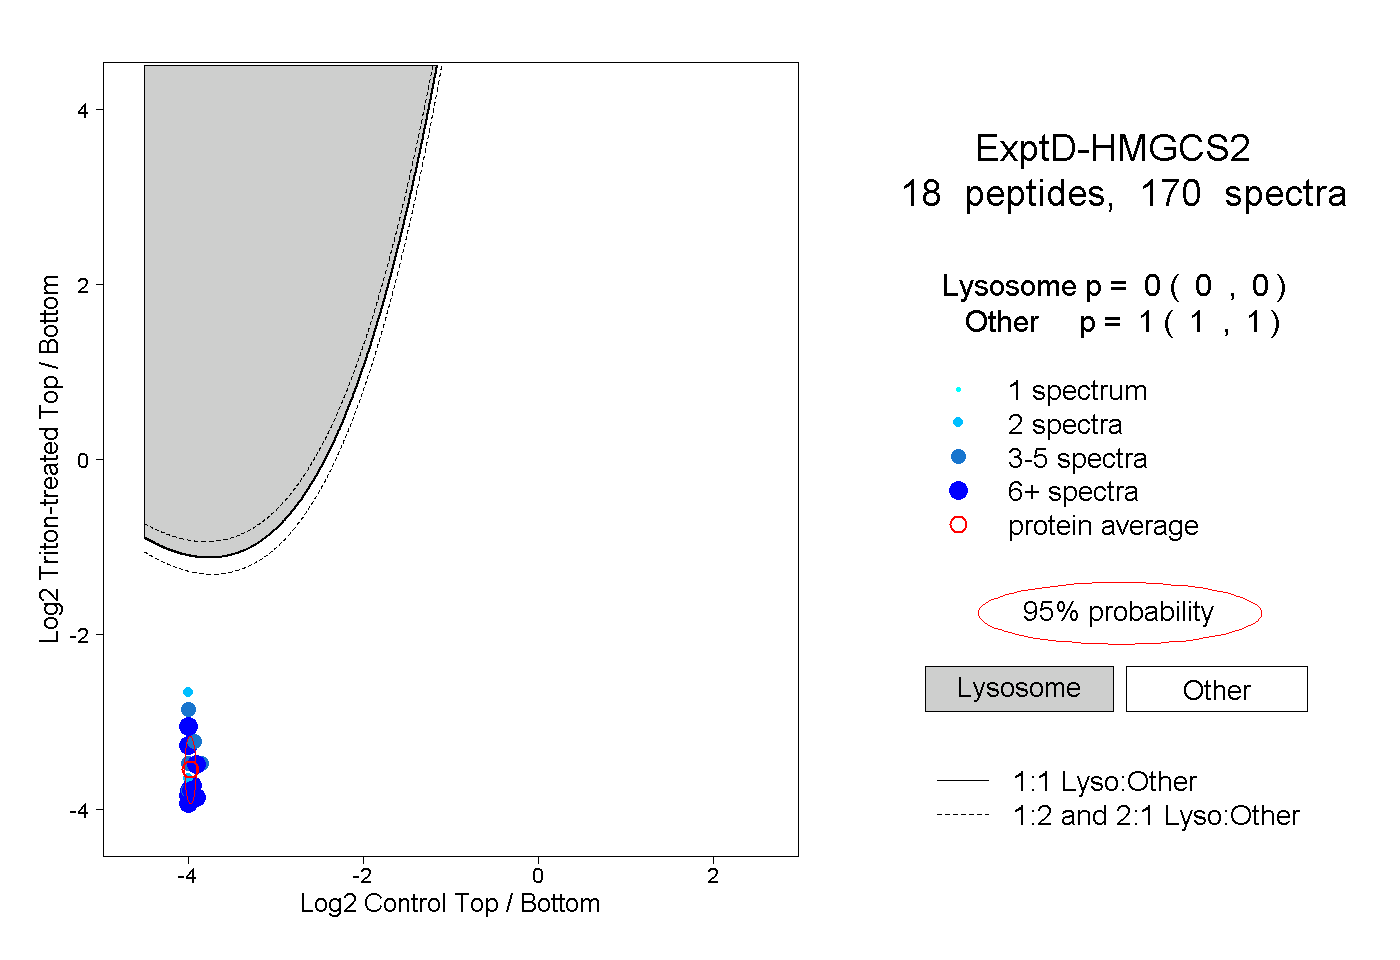
0.000 | 0.000
1.000 | 1.000