 8
8peptides
spectra
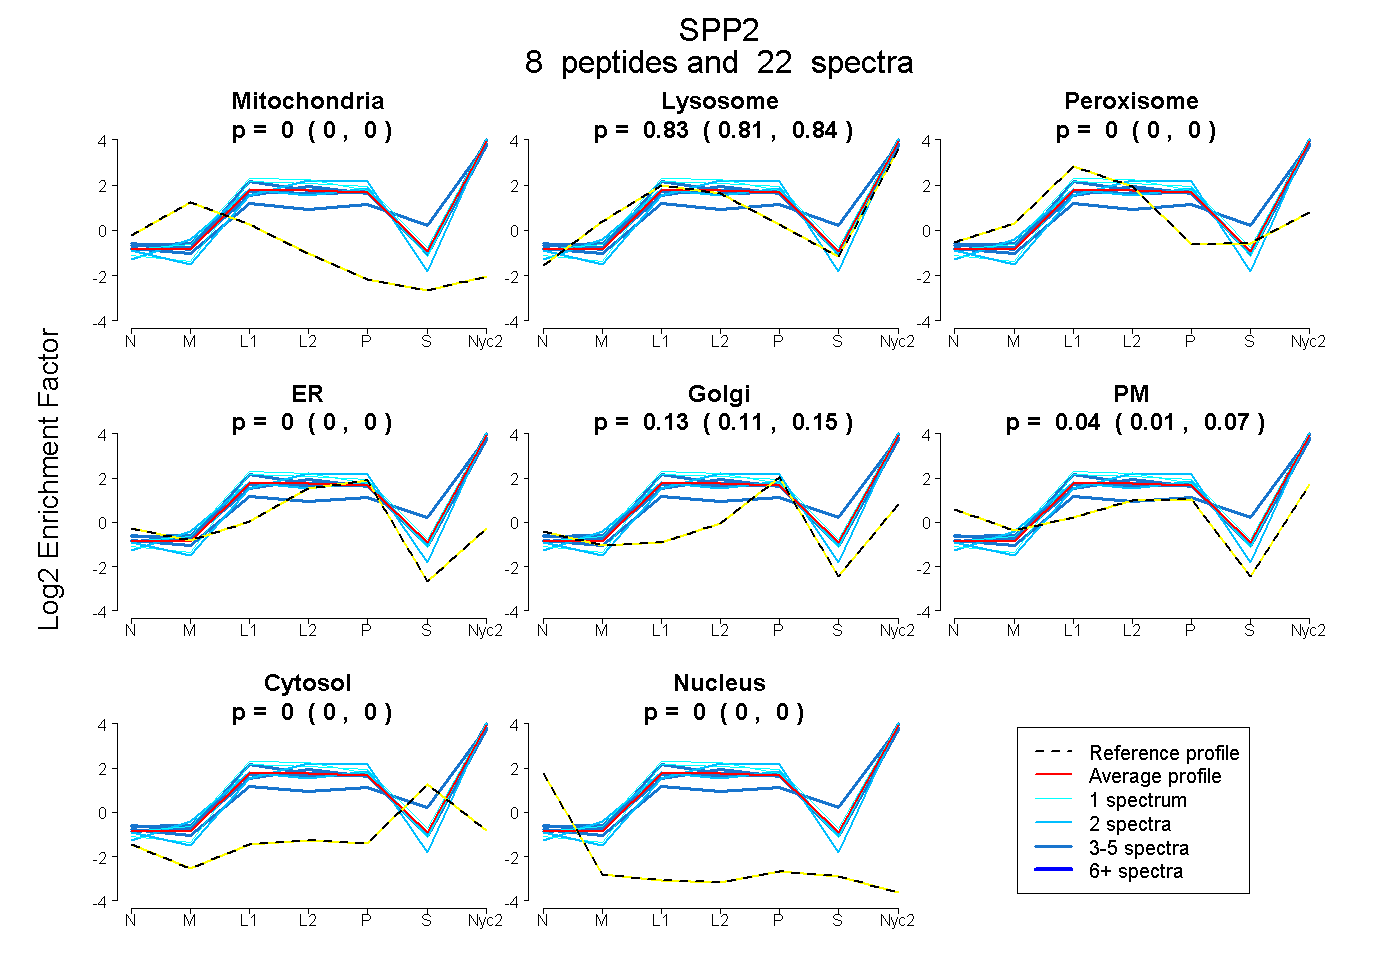
0.000 | 0.000
0.811 | 0.838
0.000 | 0.000
0.000 | 0.000
0.109 | 0.152
0.010 | 0.068
0.000 | 0.000
0.000 | 0.000
7peptides
spectra
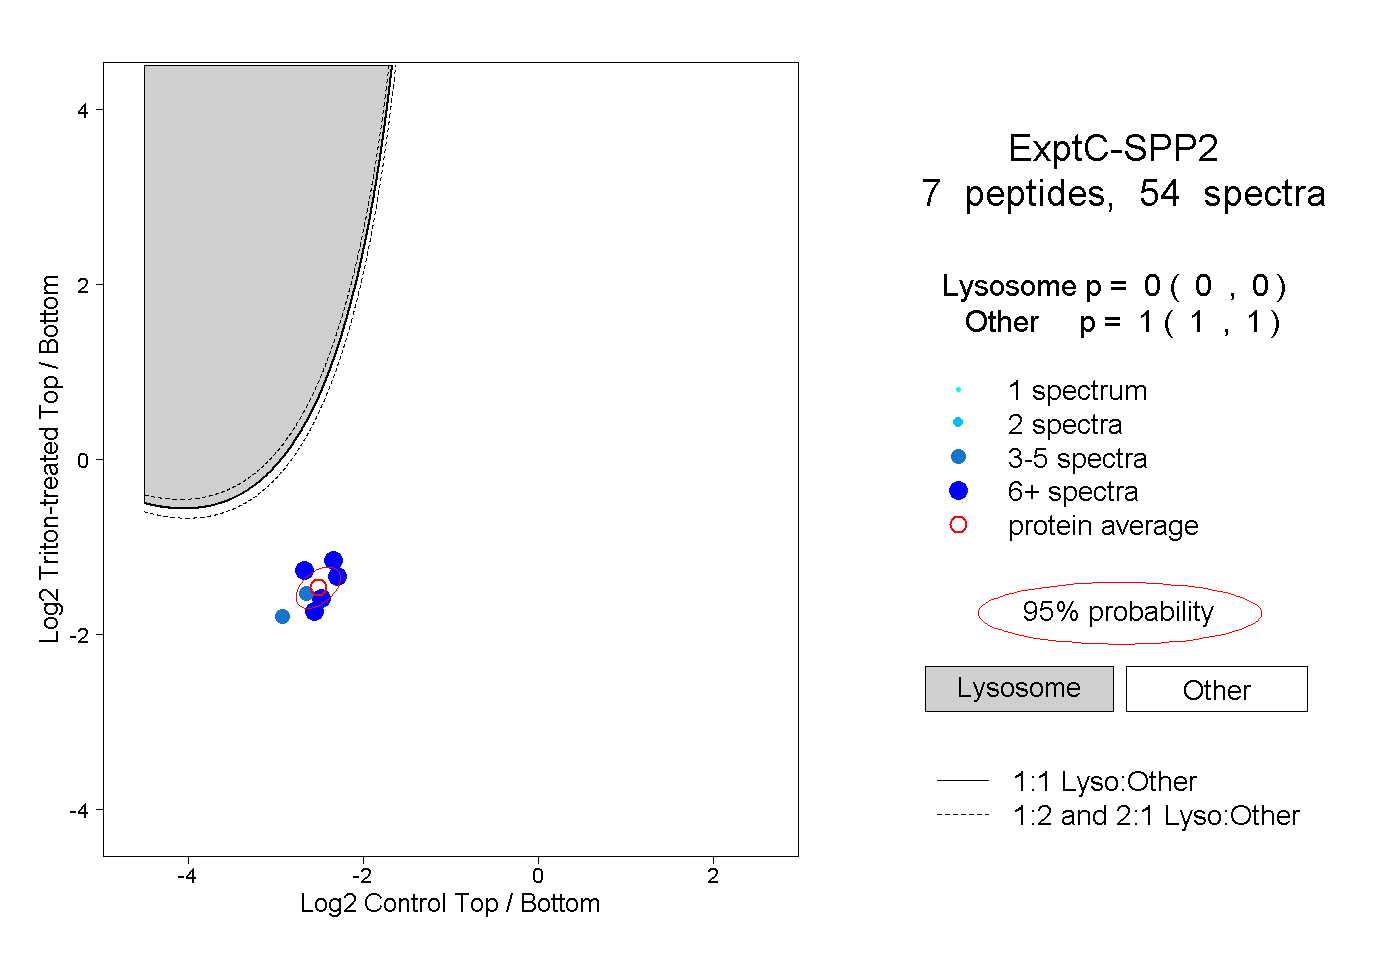
0.000 | 0.000
1.000 | 1.000
2peptides
spectra
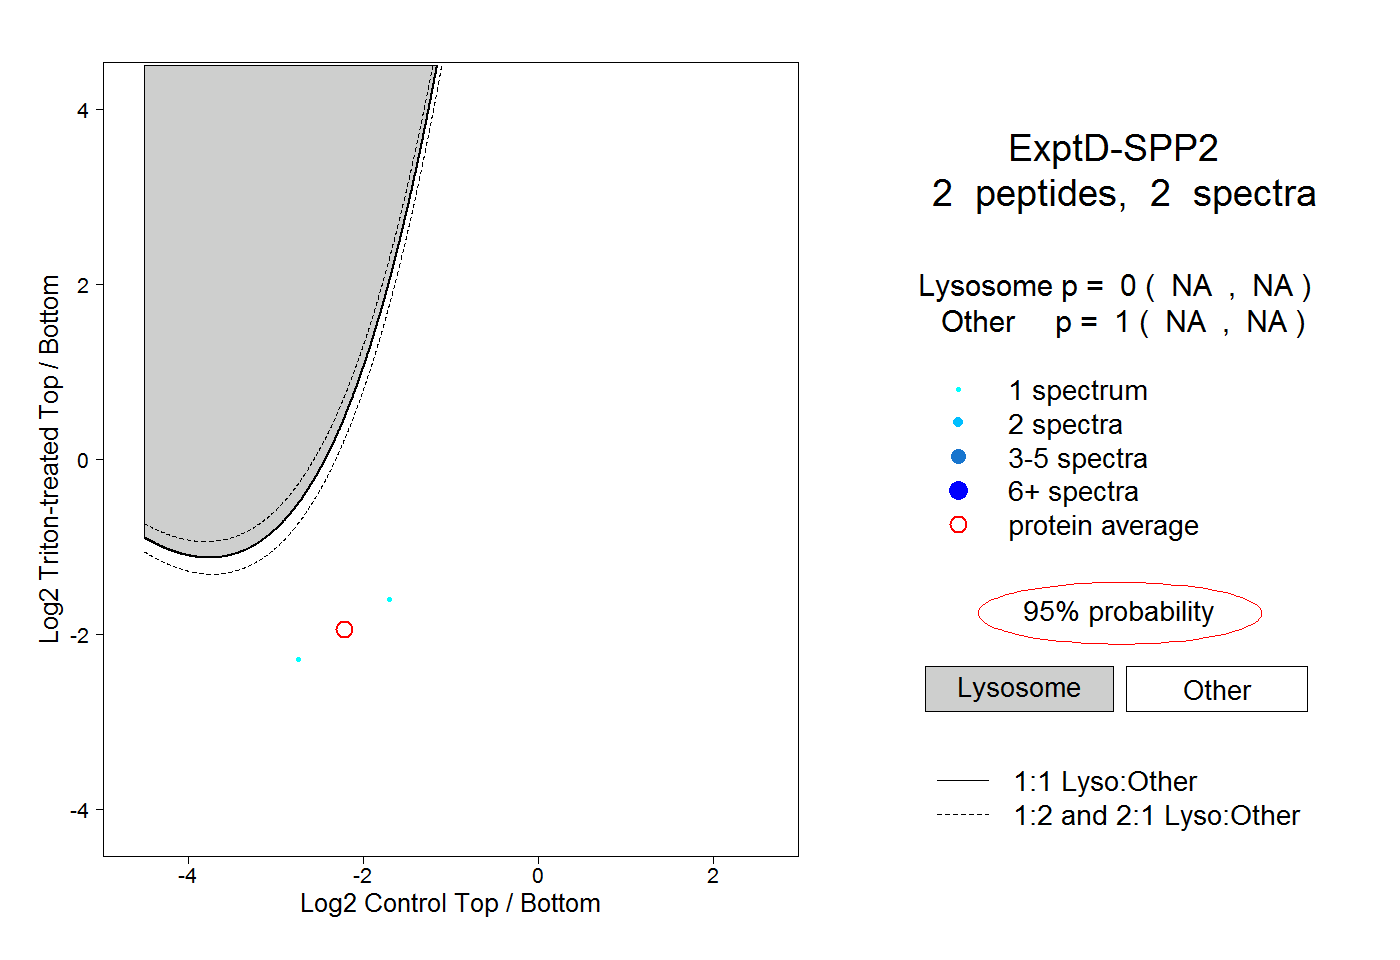
NA | NA
NA | NA