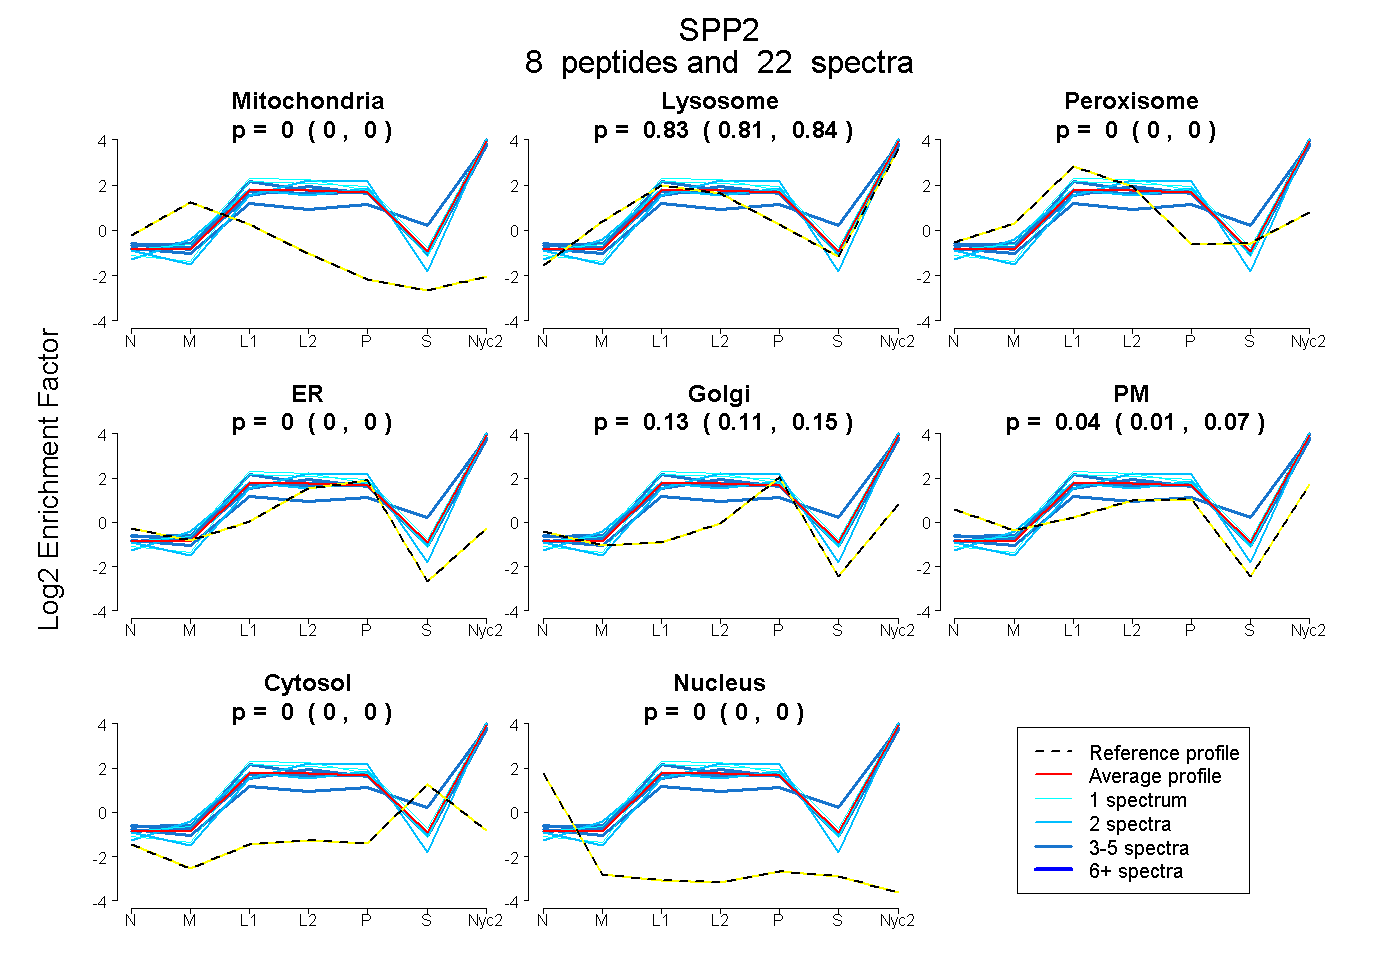
 8
8peptides
spectra
0.000 | 0.000
0.811 | 0.838
0.000 | 0.000
0.000 | 0.000
0.109 | 0.152
0.010 | 0.068
0.000 | 0.000
0.000 | 0.000
| Plot | Mito | Lyso | Perox | ER | Golgi | PM | Cytosol | Nucleus | |||||
| Expt A |
8 peptides |
22 spectra |
|
0.000 0.000 | 0.000 |
0.825 0.811 | 0.838 |
0.000 0.000 | 0.000 |
0.000 0.000 | 0.000 |
0.132 0.109 | 0.152 |
0.043 0.010 | 0.068 |
0.000 0.000 | 0.000 |
0.000 0.000 | 0.000 |
| 4 spectra, FLNLQR | 0.000 | 0.823 | 0.000 | 0.000 | 0.114 | 0.063 | 0.000 | 0.000 | ||
| 4 spectra, GYSVPTAACR | 0.000 | 0.805 | 0.000 | 0.000 | 0.000 | 0.195 | 0.000 | 0.000 | ||
| 5 spectra, GEQFYDR | 0.000 | 0.792 | 0.000 | 0.000 | 0.068 | 0.000 | 0.140 | 0.000 | ||
| 2 spectra, SIEITR | 0.000 | 0.869 | 0.000 | 0.000 | 0.131 | 0.000 | 0.000 | 0.000 | ||
| 3 spectra, ESGDPSTCAFQR | 0.000 | 0.756 | 0.000 | 0.000 | 0.079 | 0.164 | 0.000 | 0.000 | ||
| 1 spectrum, VNSQSLSPYLFR | 0.000 | 0.892 | 0.000 | 0.037 | 0.000 | 0.070 | 0.000 | 0.000 | ||
| 2 spectra, VNSGFE | 0.000 | 0.712 | 0.000 | 0.021 | 0.167 | 0.100 | 0.000 | 0.000 | ||
| 1 spectrum, STVQMSK | 0.000 | 0.886 | 0.000 | 0.000 | 0.114 | 0.000 | 0.000 | 0.000 |
| Plot | Lyso | Other | |||||||||||
| Expt C |
7 peptides |
54 spectra |
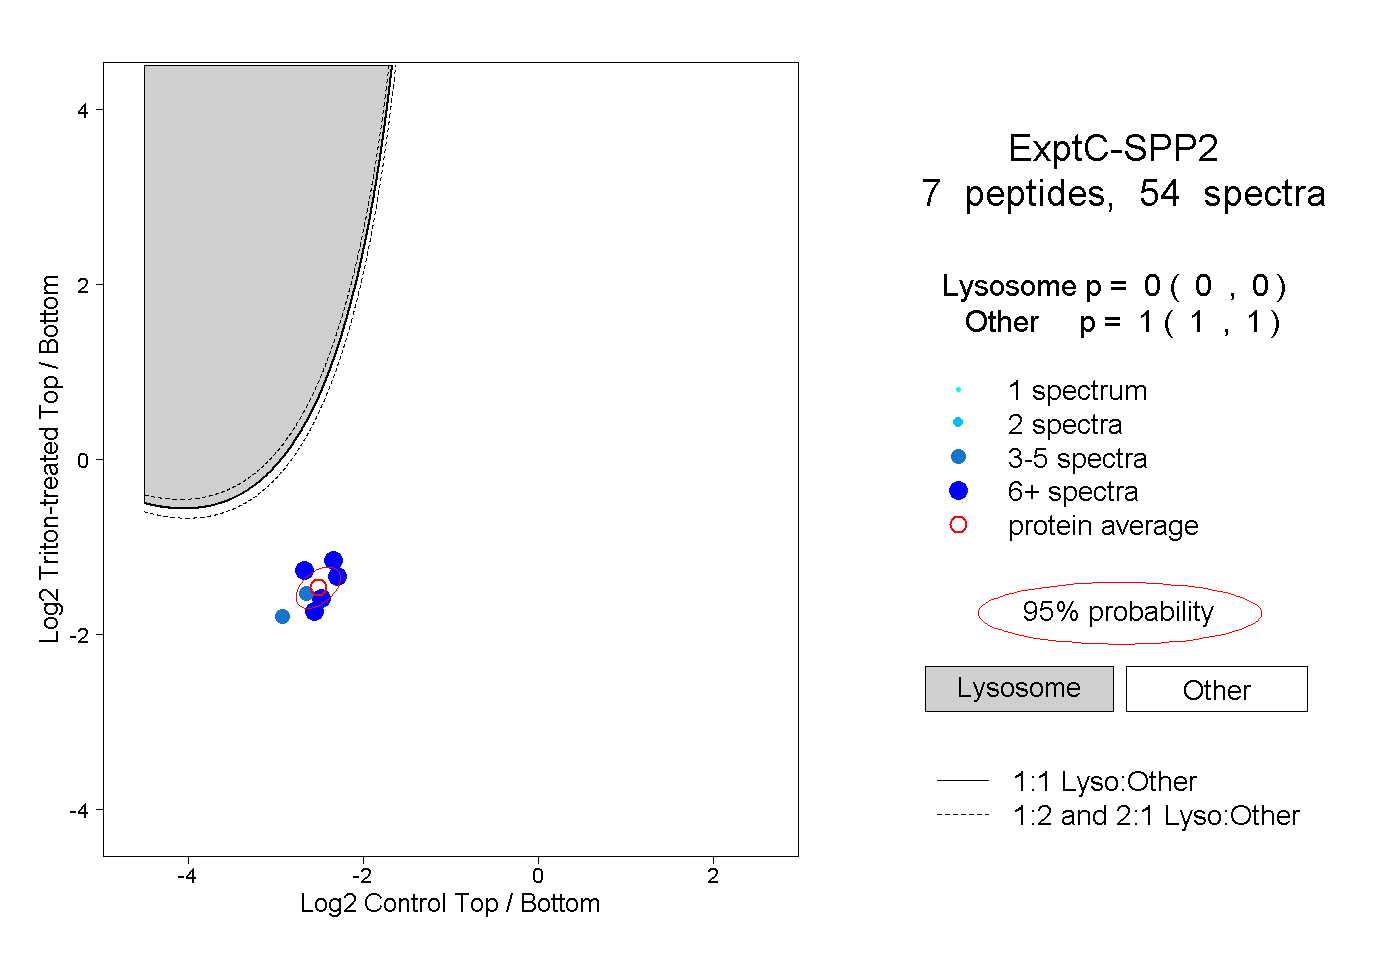 |
0.000 0.000 | 0.000 |
1.000 1.000 | 1.000 |
||||||||
| Plot | Lyso | Other | |||||||||||
| Expt D |
2 peptides |
2 spectra |
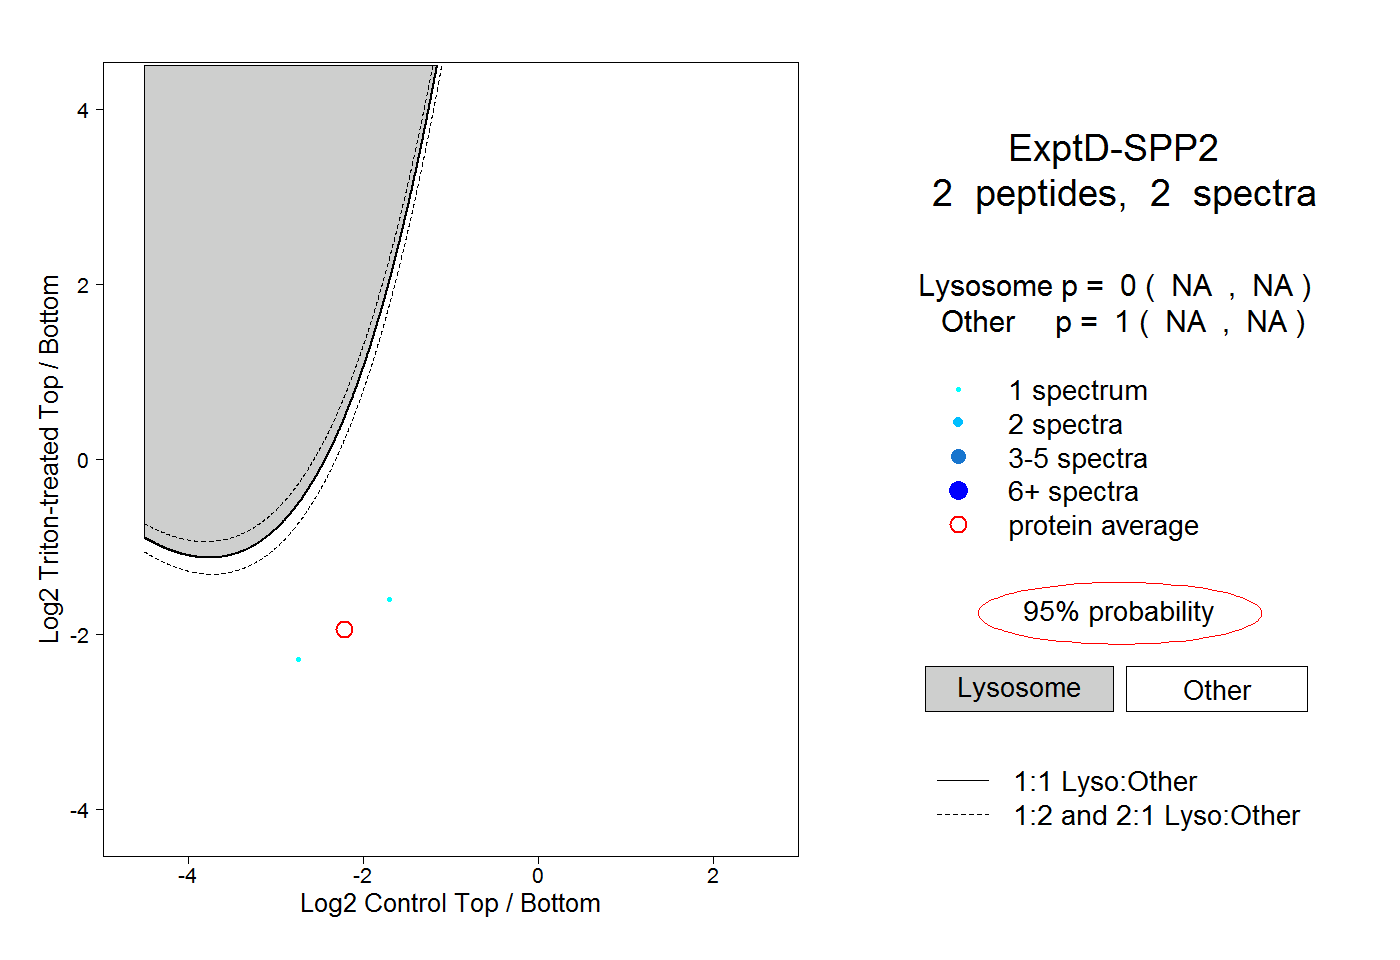 |
0.000 NA | NA |
1.000 NA | NA |