 6
6peptides
spectra
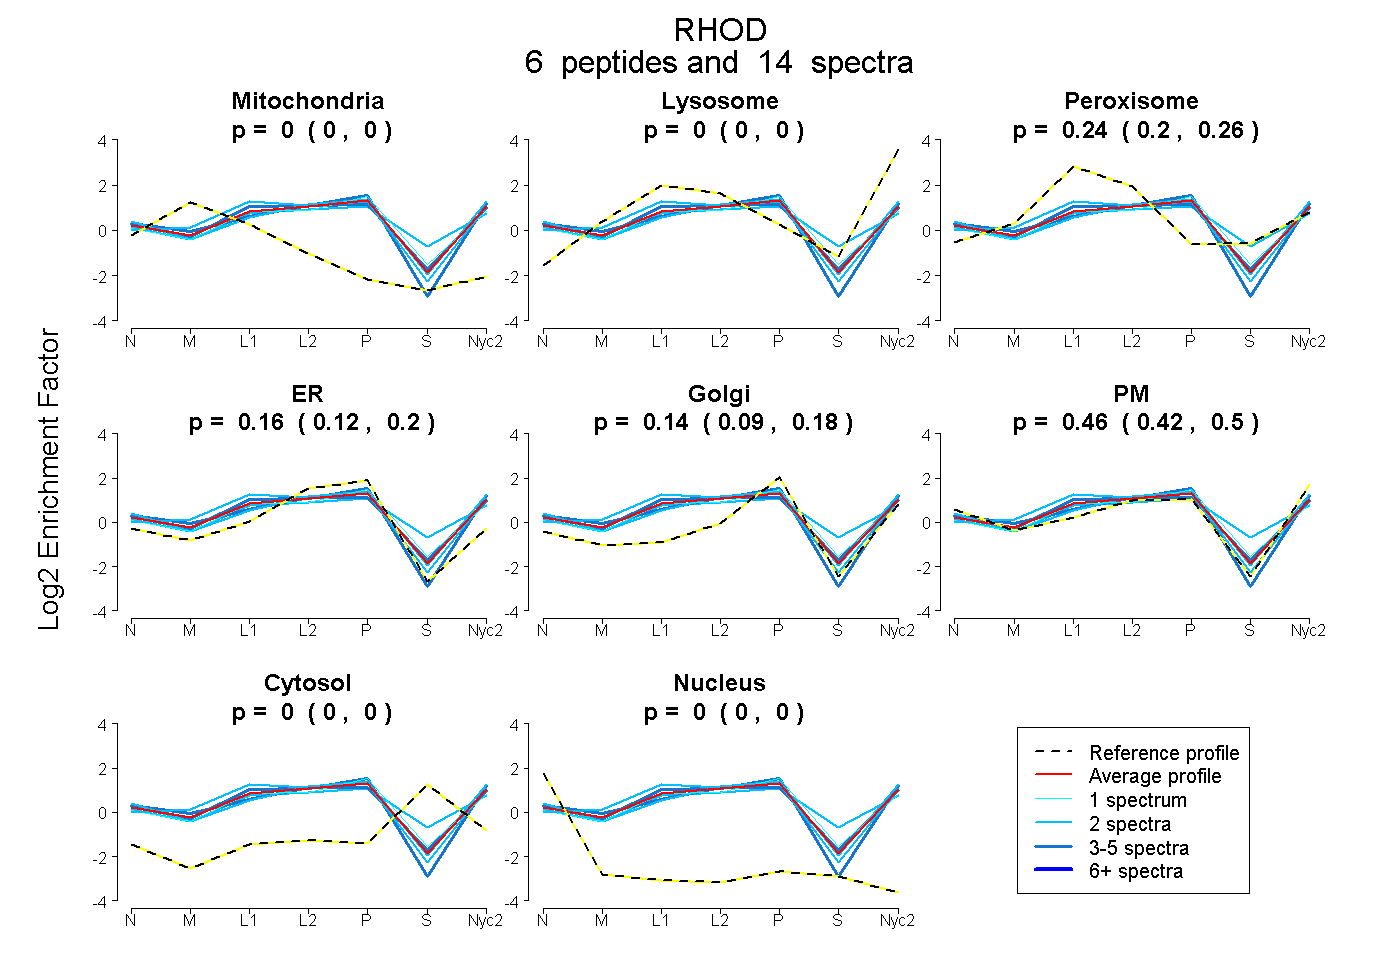
0.000 | 0.000
0.000 | 0.002
0.203 | 0.265
0.124 | 0.196
0.087 | 0.178
0.416 | 0.503
0.000 | 0.000
0.000 | 0.000
3peptides
spectra
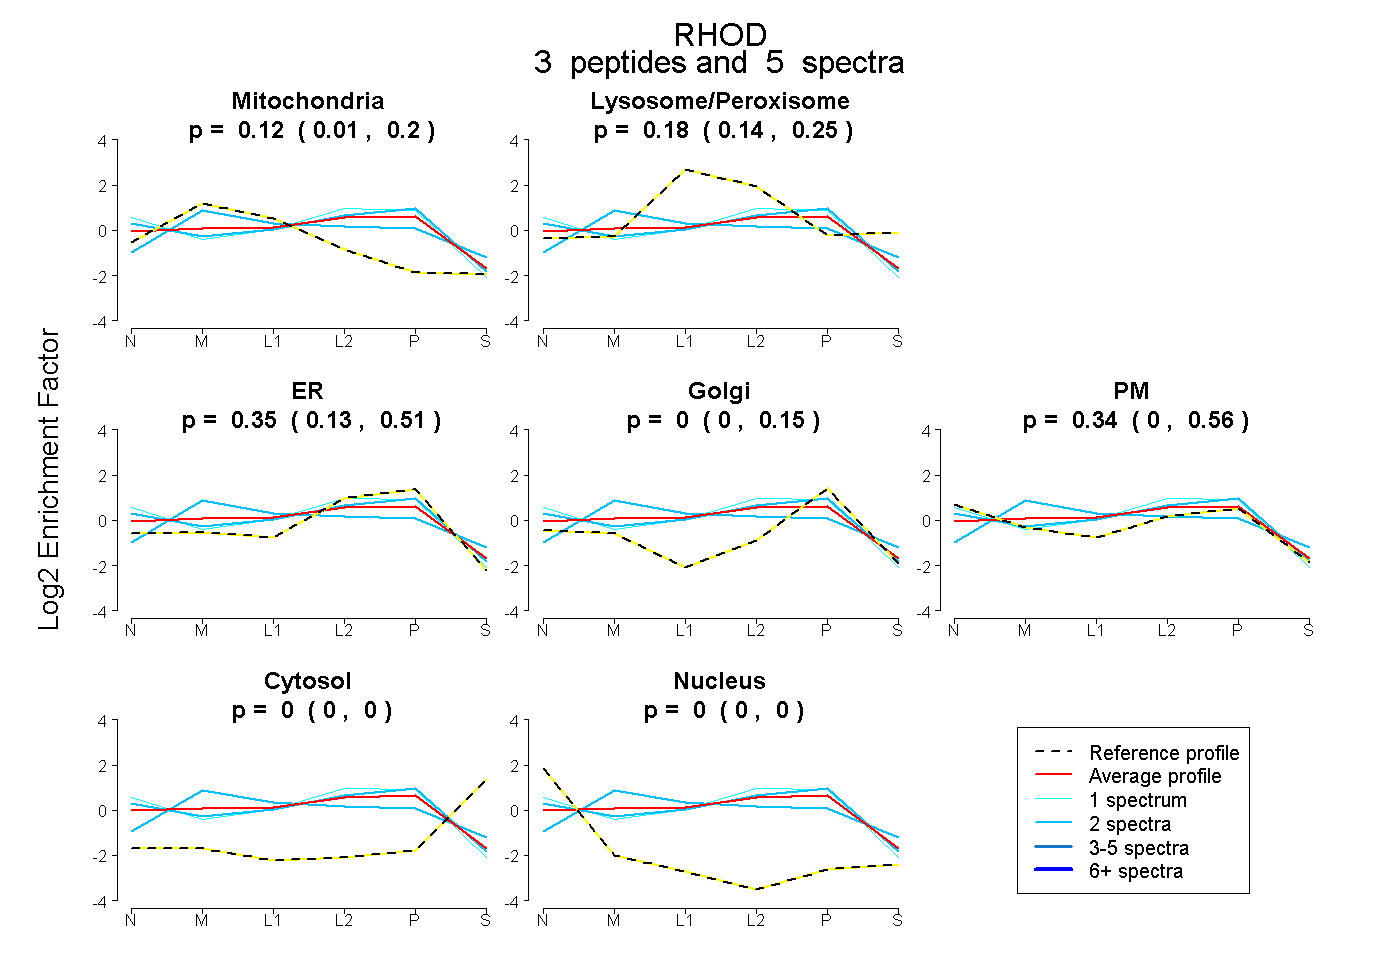
0.009 | 0.202
0.137 | 0.253
0.126 | 0.506
0.000 | 0.149
0.001 | 0.555
0.000 | 0.000
0.000 | 0.000
8peptides
spectra
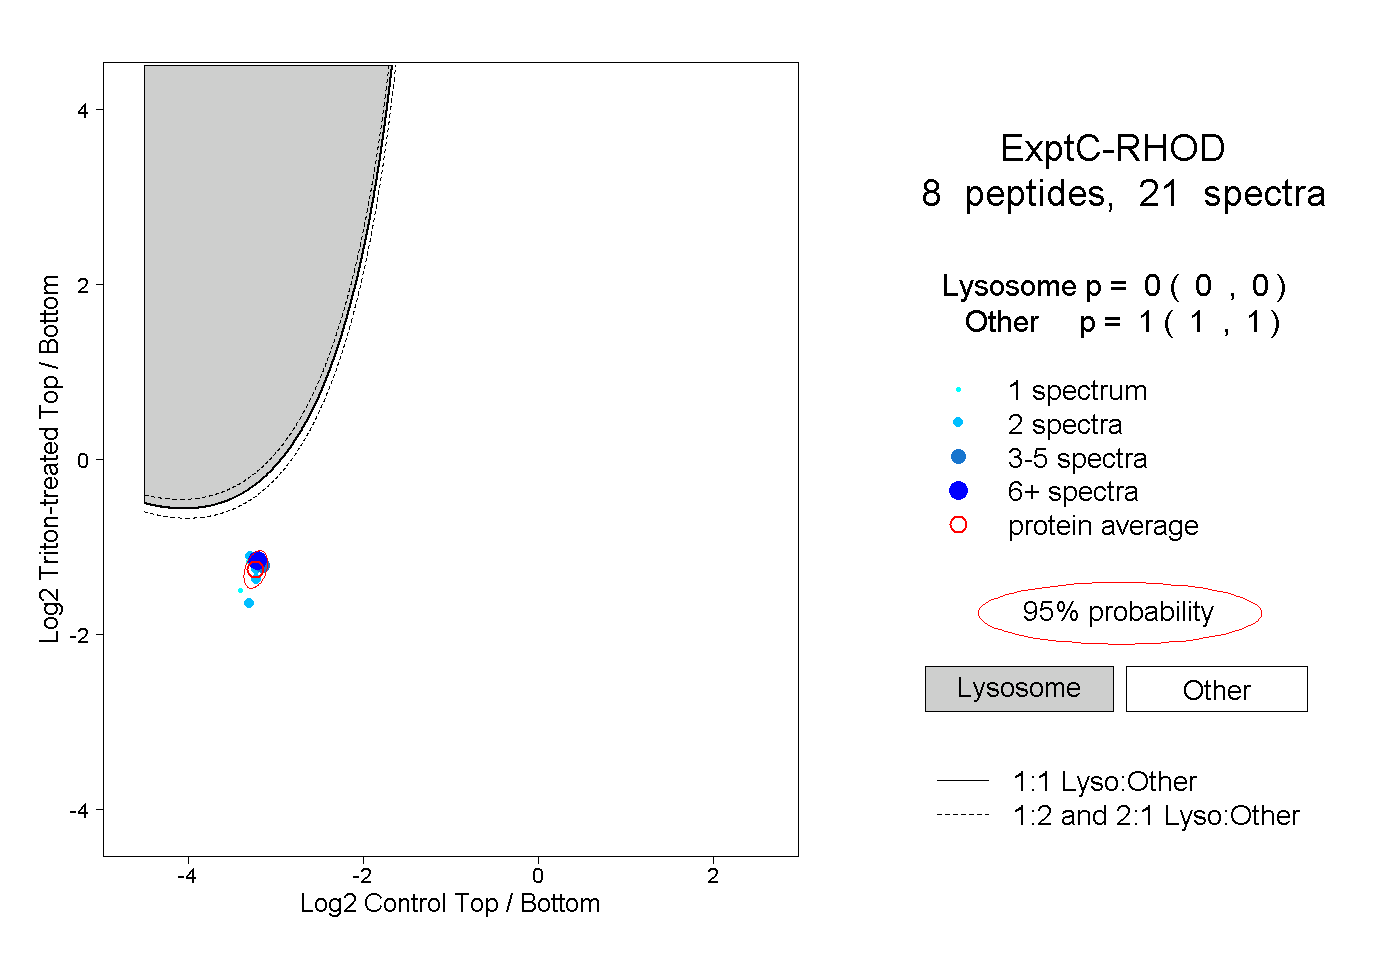
0.000 | 0.000
1.000 | 1.000