 6
6peptides
spectra
0.000 | 0.000
0.000 | 0.002
0.203 | 0.265
0.124 | 0.196
0.087 | 0.178
0.416 | 0.503
0.000 | 0.000
0.000 | 0.000
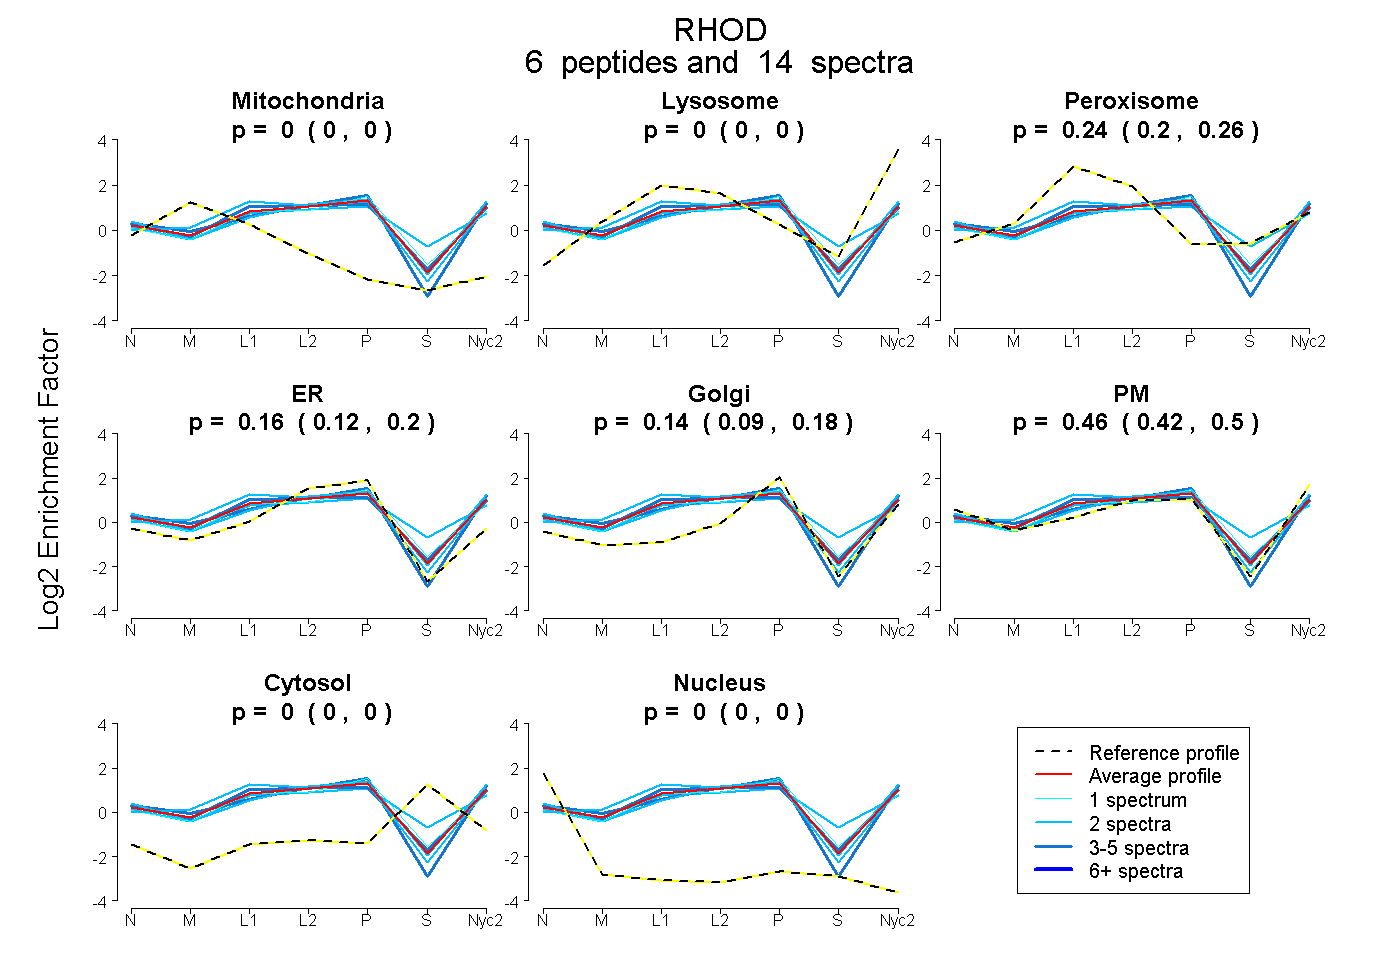
| Plot | Mito | Lyso | Perox | ER | Golgi | PM | Cytosol | Nucleus | |||||
| Expt A |
6 peptides |
14 spectra |
|
0.000 0.000 | 0.000 |
0.000 0.000 | 0.002 |
0.236 0.203 | 0.265 |
0.164 0.124 | 0.196 |
0.136 0.087 | 0.178 |
0.464 0.416 | 0.503 |
0.000 0.000 | 0.000 |
0.000 0.000 | 0.000 |
| 4 spectra, SHNFWR | 0.000 | 0.000 | 0.239 | 0.135 | 0.131 | 0.495 | 0.000 | 0.000 | ||
| 2 spectra, VLVNTLR | 0.000 | 0.004 | 0.129 | 0.159 | 0.066 | 0.642 | 0.000 | 0.000 | ||
| 3 spectra, LQIWDTAGQDDYDR | 0.000 | 0.063 | 0.035 | 0.305 | 0.000 | 0.597 | 0.000 | 0.000 | ||
| 1 spectrum, WYPEVTHFCK | 0.000 | 0.000 | 0.314 | 0.129 | 0.363 | 0.194 | 0.000 | 0.000 | ||
| 2 spectra, YNATLQMK | 0.009 | 0.097 | 0.186 | 0.293 | 0.000 | 0.416 | 0.000 | 0.000 | ||
| 2 spectra, GVPIIVVGCK | 0.000 | 0.000 | 0.394 | 0.021 | 0.306 | 0.192 | 0.087 | 0.000 |
| Plot | Mito | Lyso or Perox | ER | Golgi | PM | Cytosol | Nucleus | ||||||
| Expt B |
3 peptides |
5 spectra |
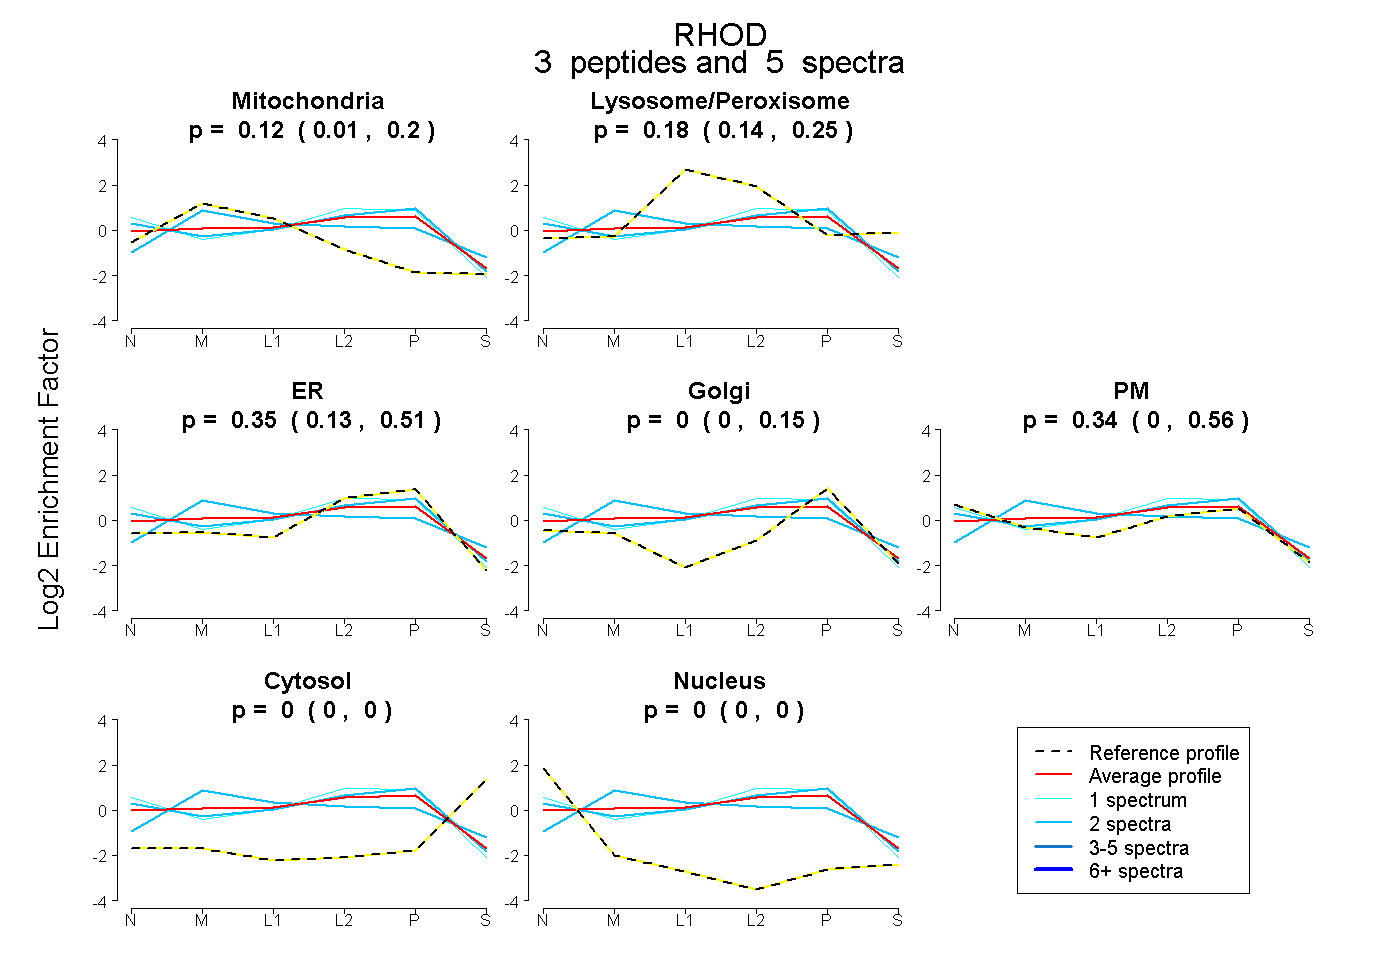 |
0.125 0.009 | 0.202 |
0.180 0.137 | 0.253 |
0.354 0.126 | 0.506 |
0.000 0.000 | 0.149 |
0.342 0.001 | 0.555 |
0.000 0.000 | 0.000 |
0.000 0.000 | 0.000 |
|||
| Plot | Lyso | Other | |||||||||||
| Expt C |
8 peptides |
21 spectra |
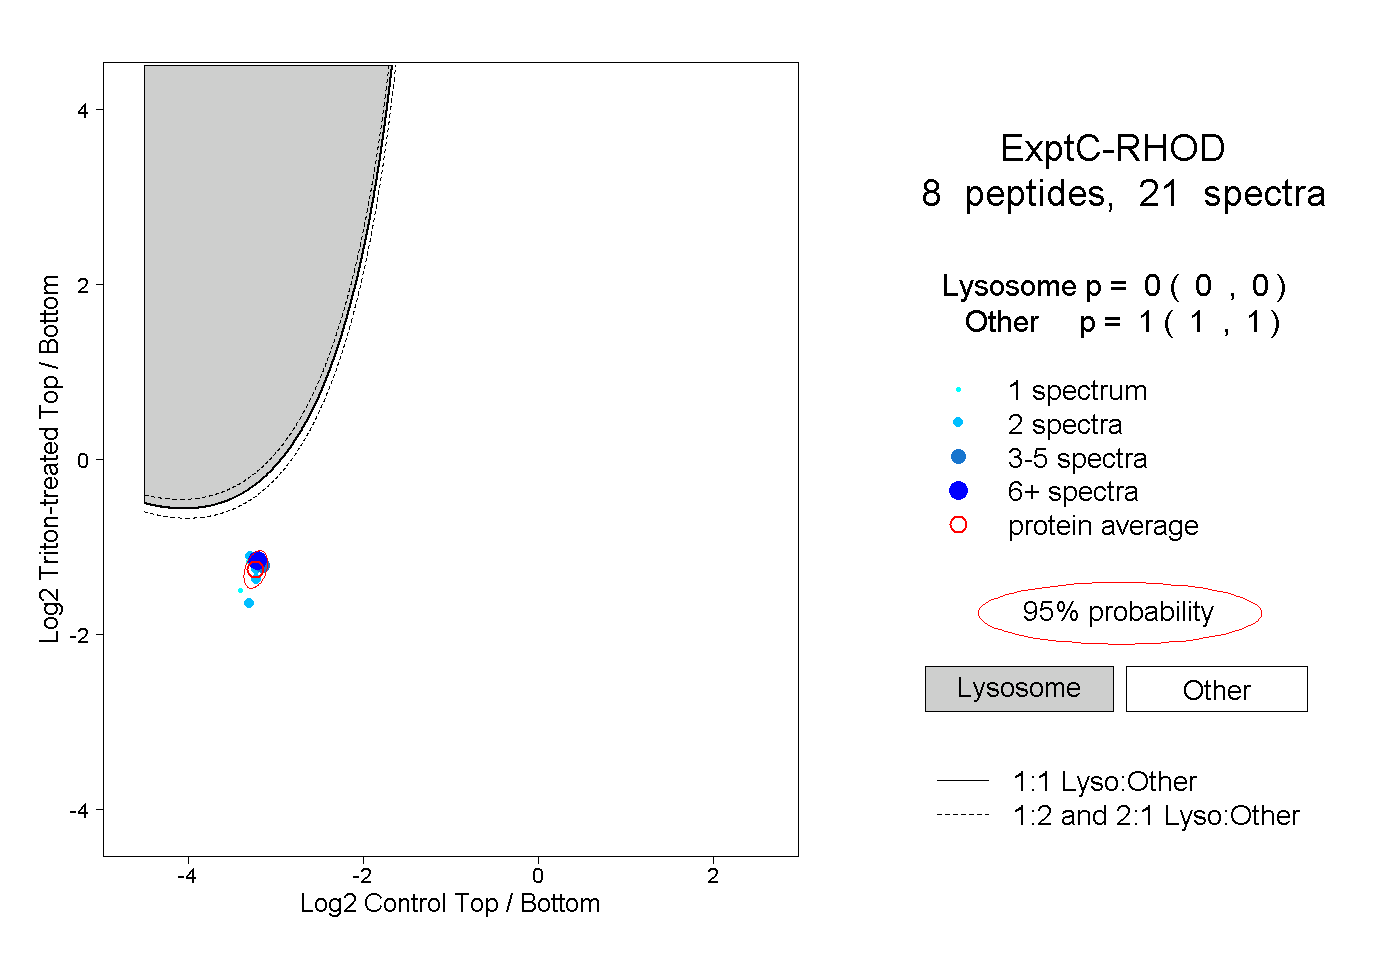 |
0.000 0.000 | 0.000 |
1.000 1.000 | 1.000 |