 6
6peptides
spectra
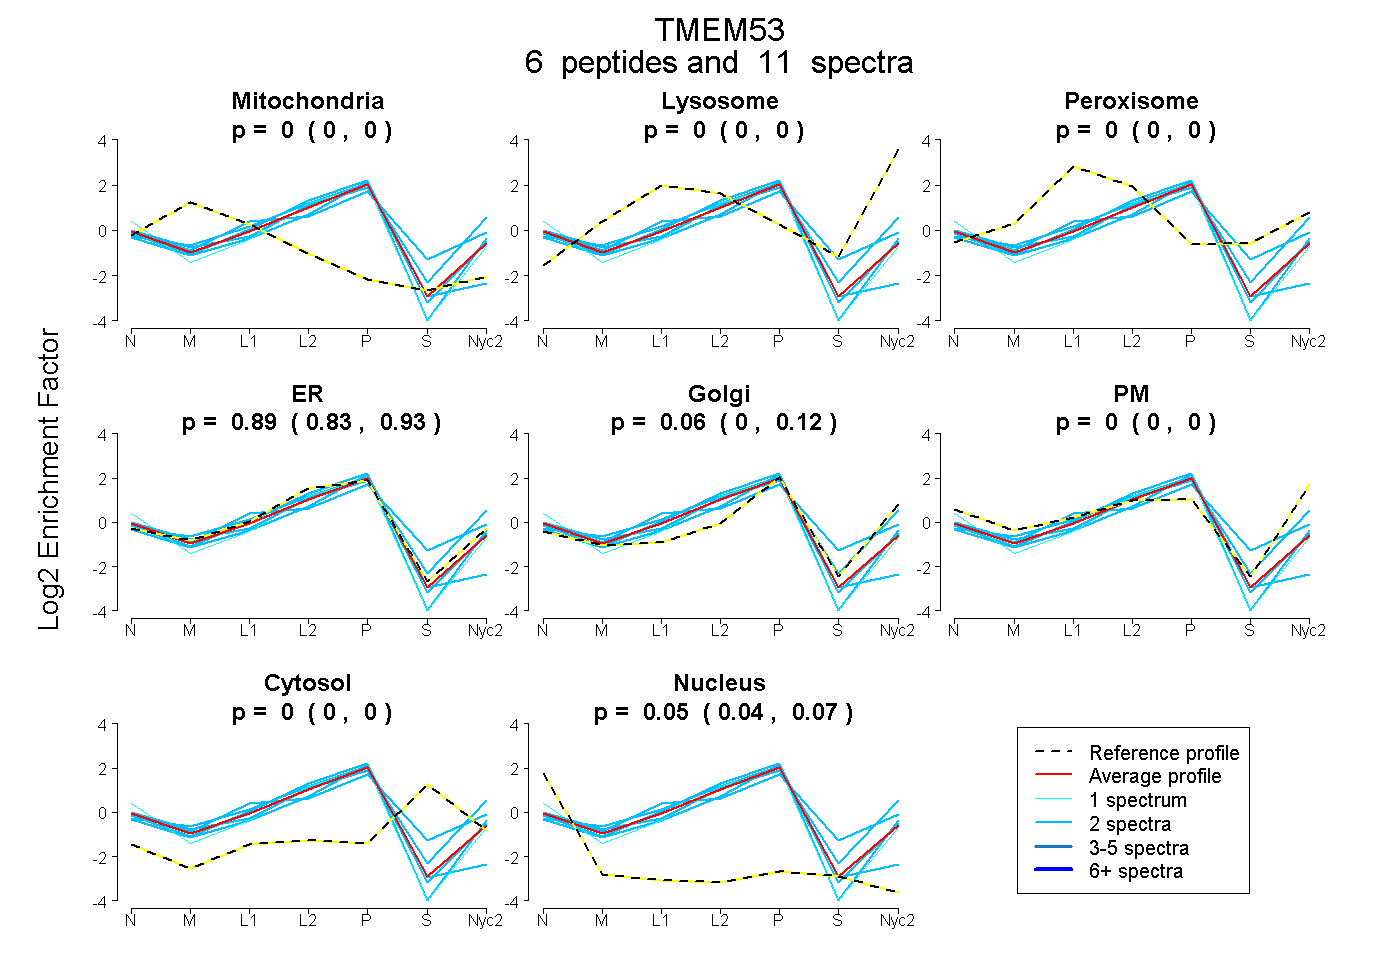
0.000 | 0.000
0.000 | 0.000
0.000 | 0.000
0.826 | 0.934
0.000 | 0.121
0.000 | 0.000
0.000 | 0.000
0.037 | 0.071
3peptides
spectra
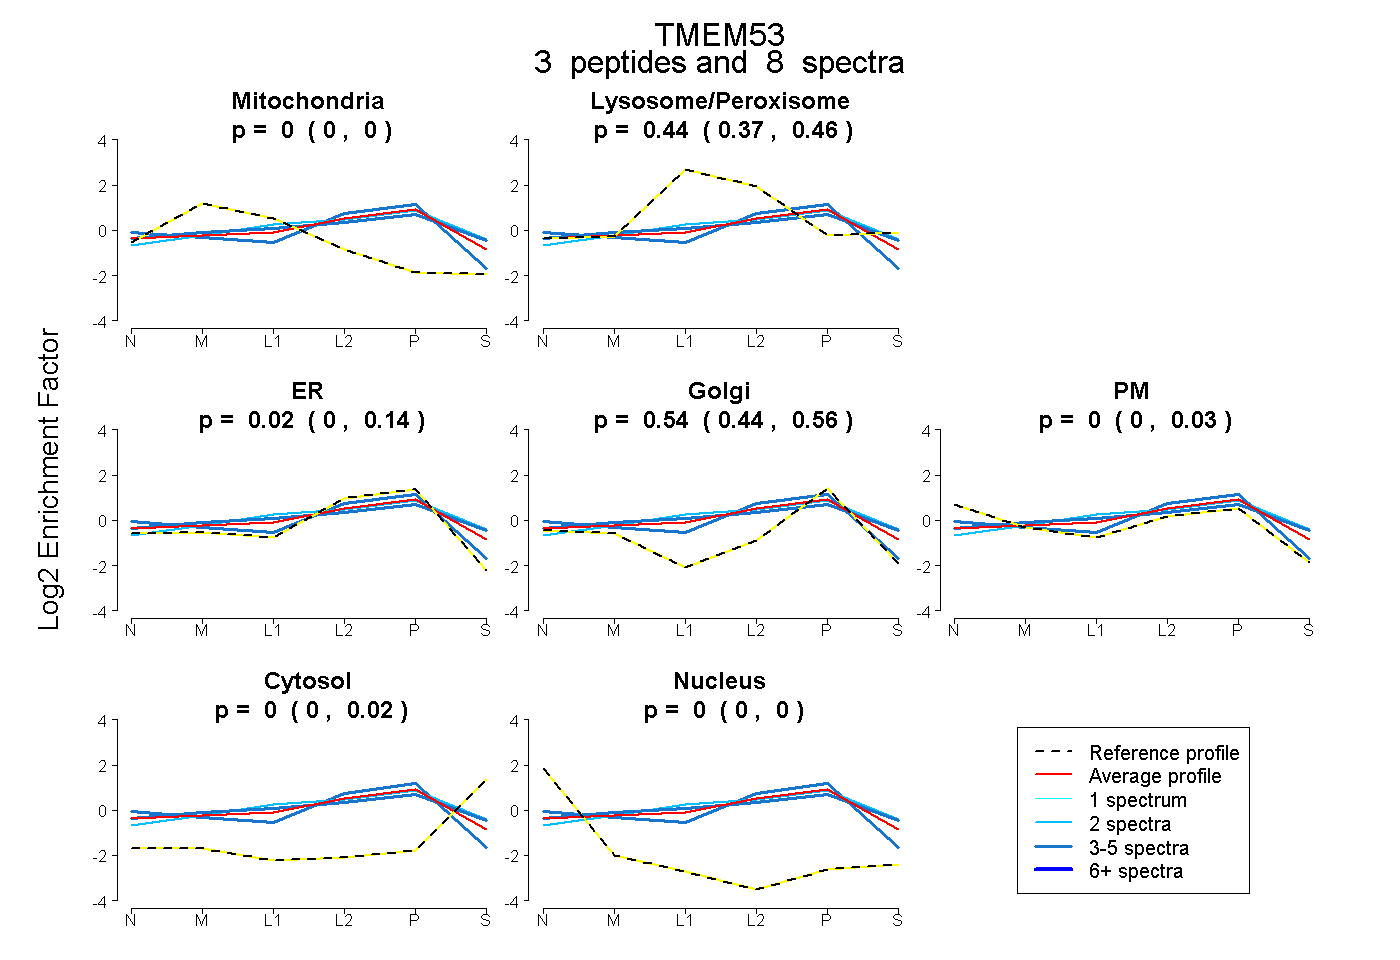
0.000 | 0.000
0.368 | 0.462
0.000 | 0.135
0.440 | 0.562
0.000 | 0.031
0.000 | 0.019
0.000 | 0.000
1peptide
spectra
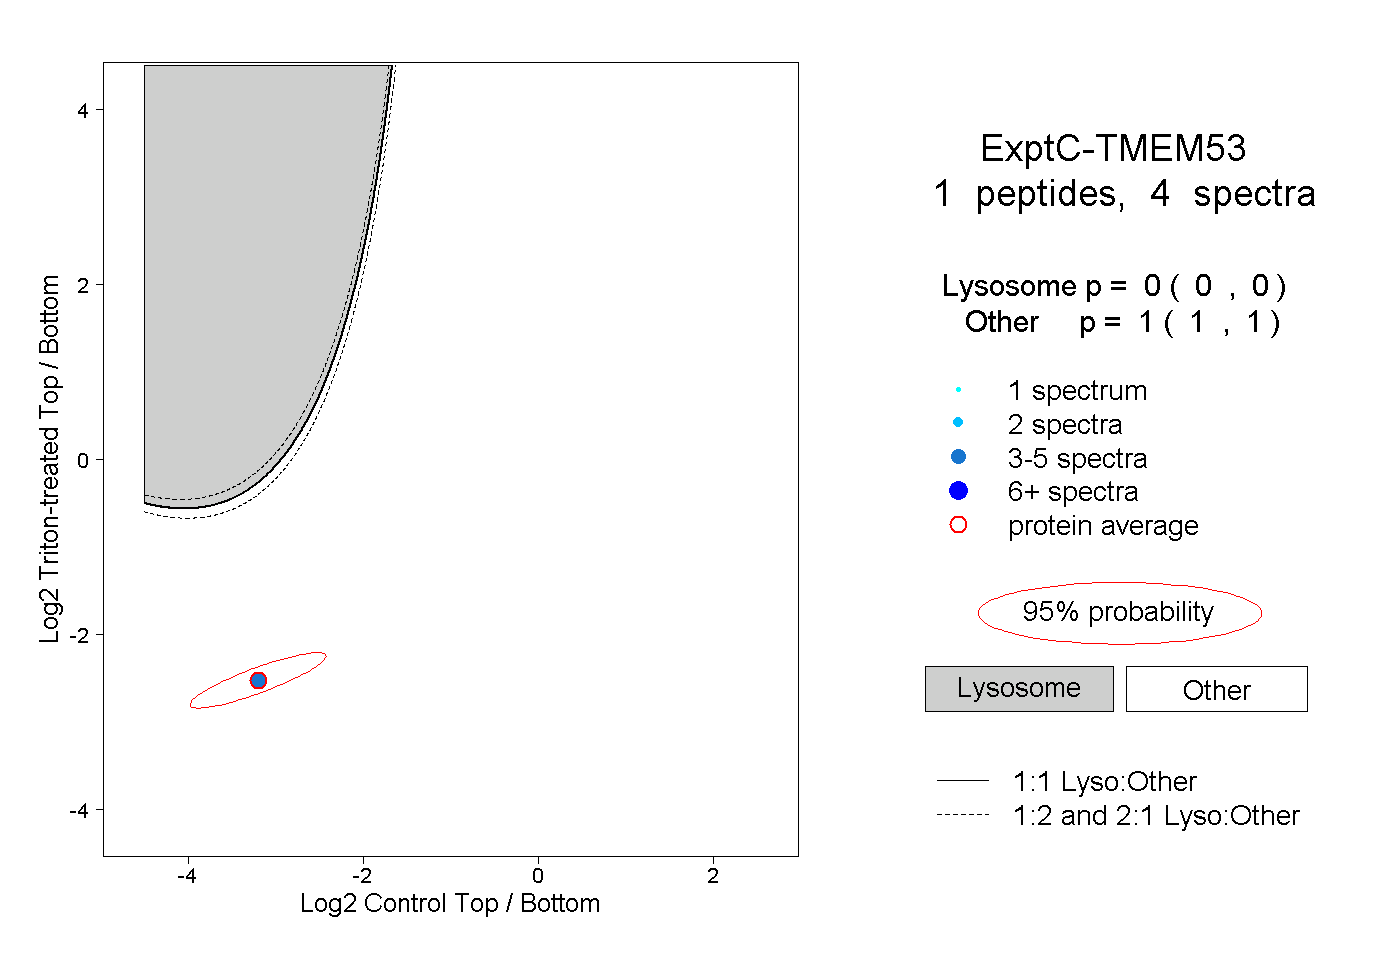
0.000 | 0.000
1.000 | 1.000
1peptide
spectra
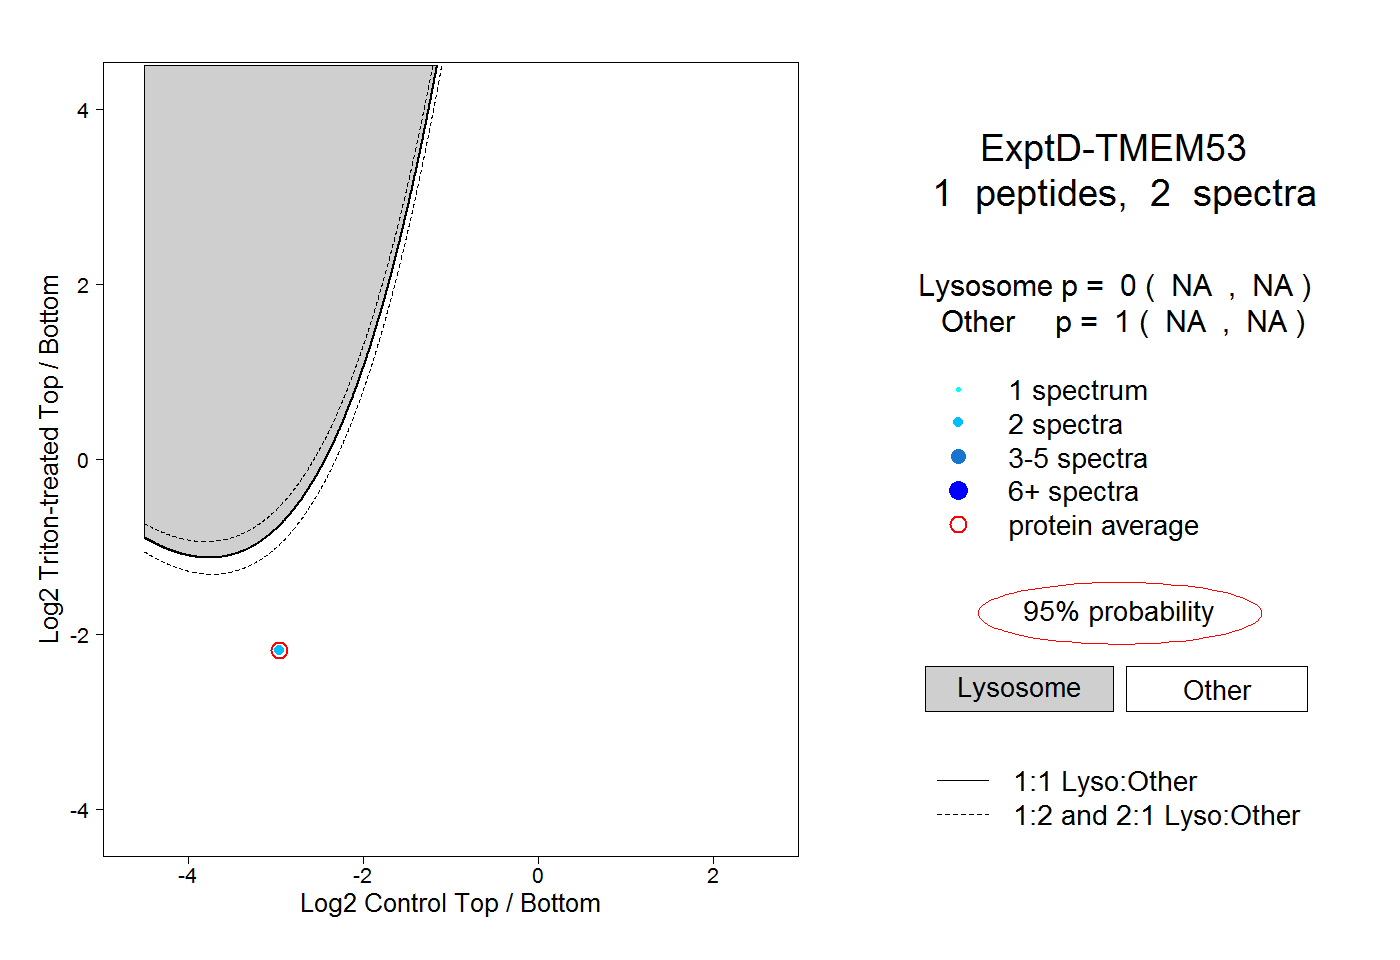
NA | NA
NA | NA