TMEM53
[ENSRNOP00000025990]
Main page
| | | Plot |
Mito |
Lyso |
|
Perox |
ER |
Golgi |
PM |
Cytosol |
Nucleus |
|
| Expt A |
 6
6
peptides |
11
spectra |
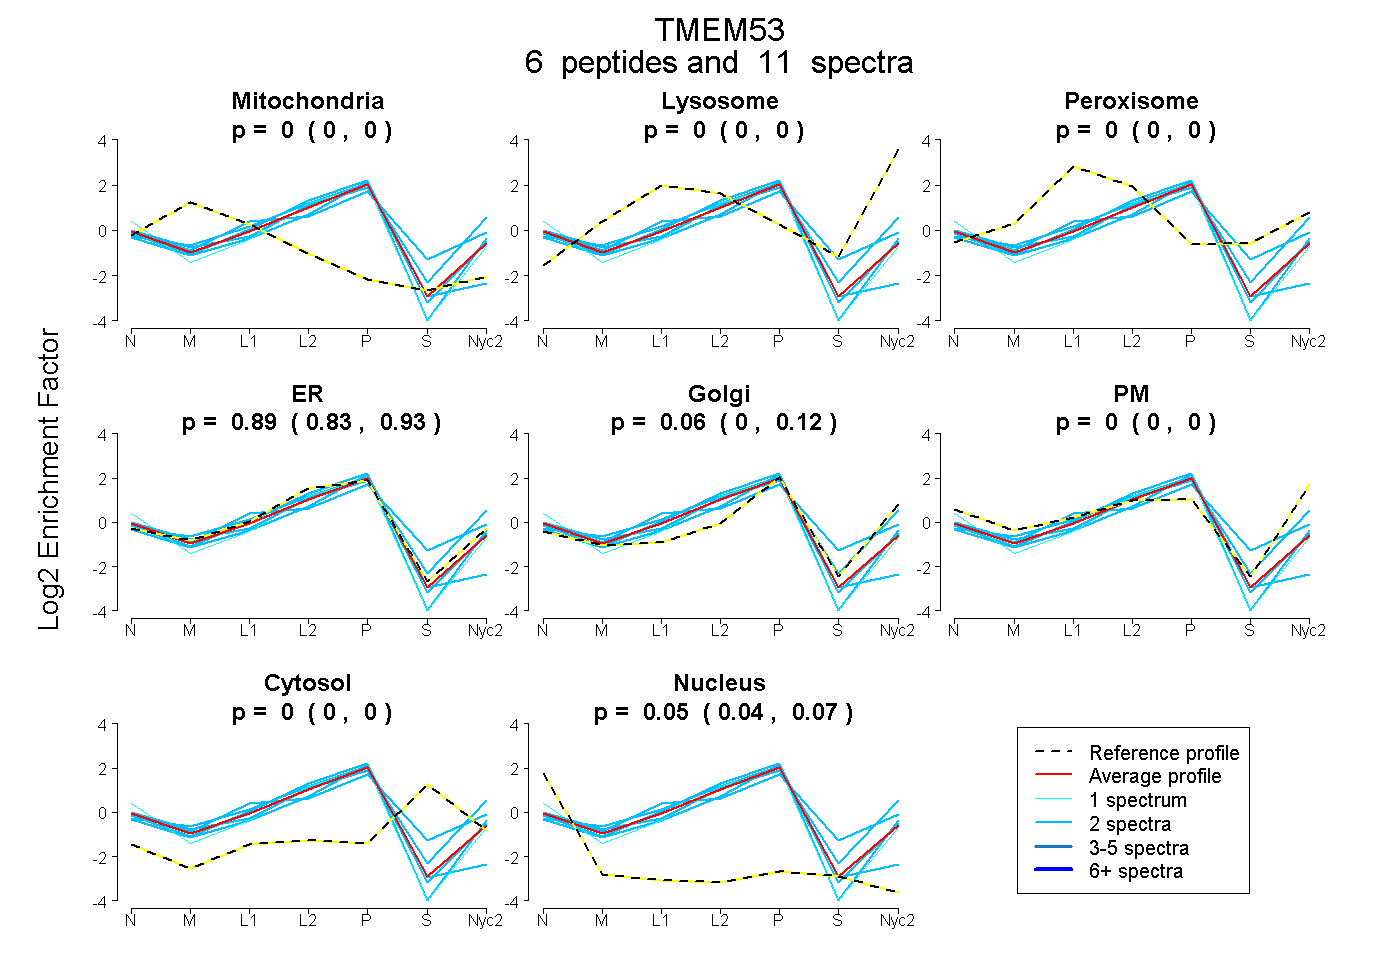 |
0.000
0.000 | 0.000 |
0.000
0.000 | 0.000 |
|
0.000
0.000 | 0.000 |
0.890
0.826 | 0.934 |
0.055
0.000 | 0.121 |
0.000
0.000 | 0.000 |
0.000
0.000 | 0.000 |
0.055
0.037 | 0.071 |
|
| | | Plot |
Mito |
|
Lyso or Perox |
|
ER |
Golgi |
PM |
Cytosol |
Nucleus |
|
| Expt B |
3
peptides |
8
spectra |
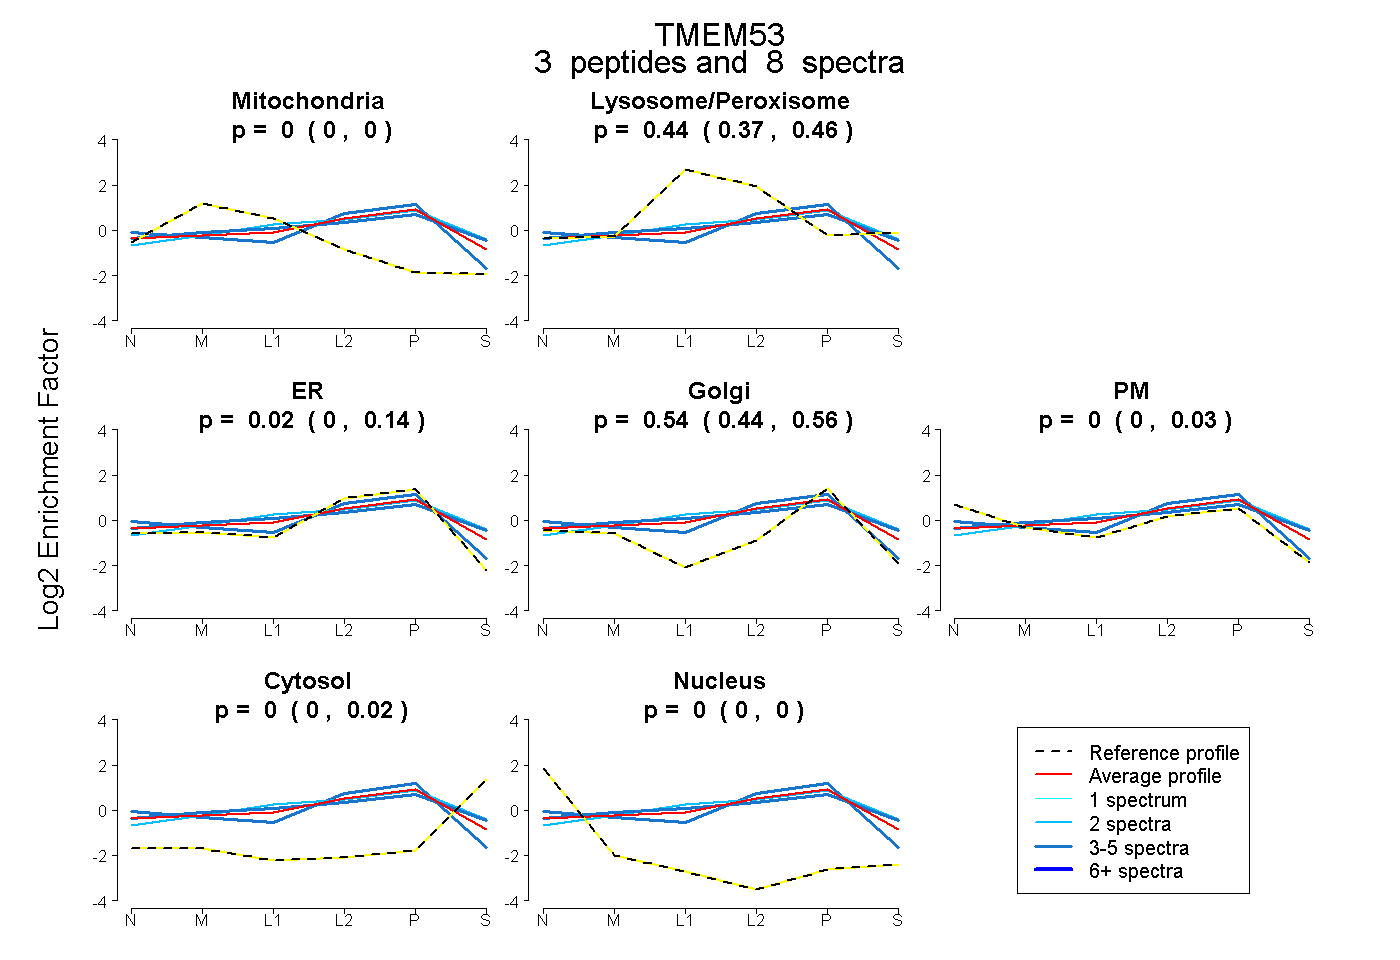 |
0.000
0.000 | 0.000 |
|
0.440
0.368 | 0.462 |
|
0.016
0.000 | 0.135 |
0.544
0.440 | 0.562 |
0.000
0.000 | 0.031 |
0.000
0.000 | 0.019 |
0.000
0.000 | 0.000 |
|
| 2 spectra, LAHQVSVR |
0.000 |
|
0.497 |
|
0.000 |
0.453 |
0.000 |
0.051 |
0.000 |
|
| 3 spectra, GCIVIR |
0.000 |
|
0.115 |
|
0.503 |
0.104 |
0.278 |
0.000 |
0.000 |
|
| 3 spectra, YVLELLQTHQR |
0.000 |
|
0.473 |
|
0.000 |
0.468 |
0.000 |
0.059 |
0.000 |
|
| | | Plot |
|
Lyso |
|
|
|
|
|
|
|
Other |
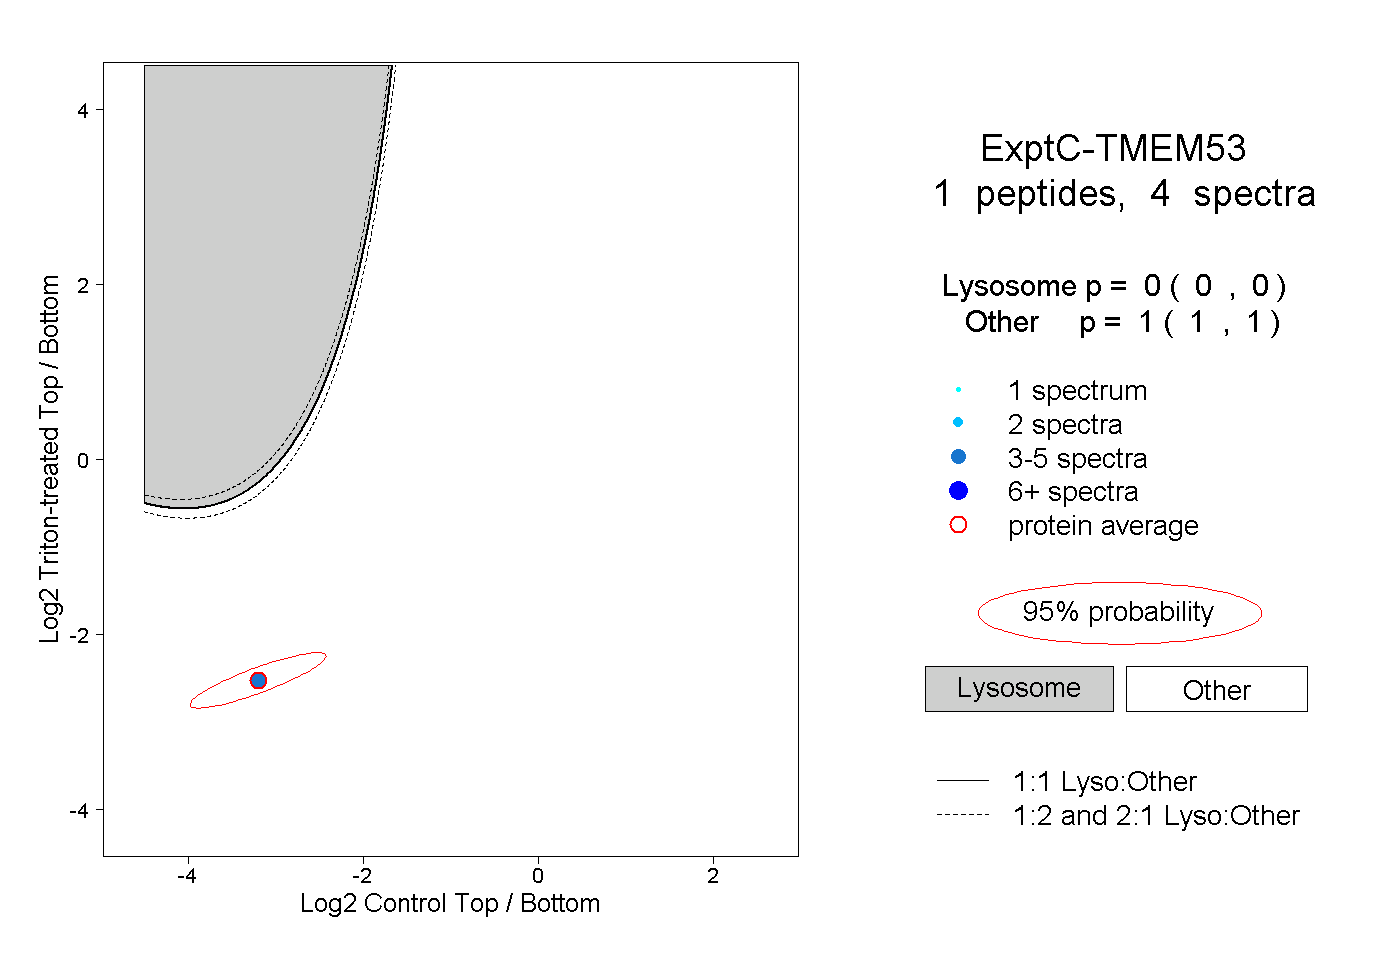
| Expt C |
1
peptide |
4
spectra |
 |
|
0.000
0.000 | 0.000 |
|
|
|
|
|
|
|
1.000
1.000 | 1.000 |
| | | Plot |
|
Lyso |
|
|
|
|
|
|
|
Other |
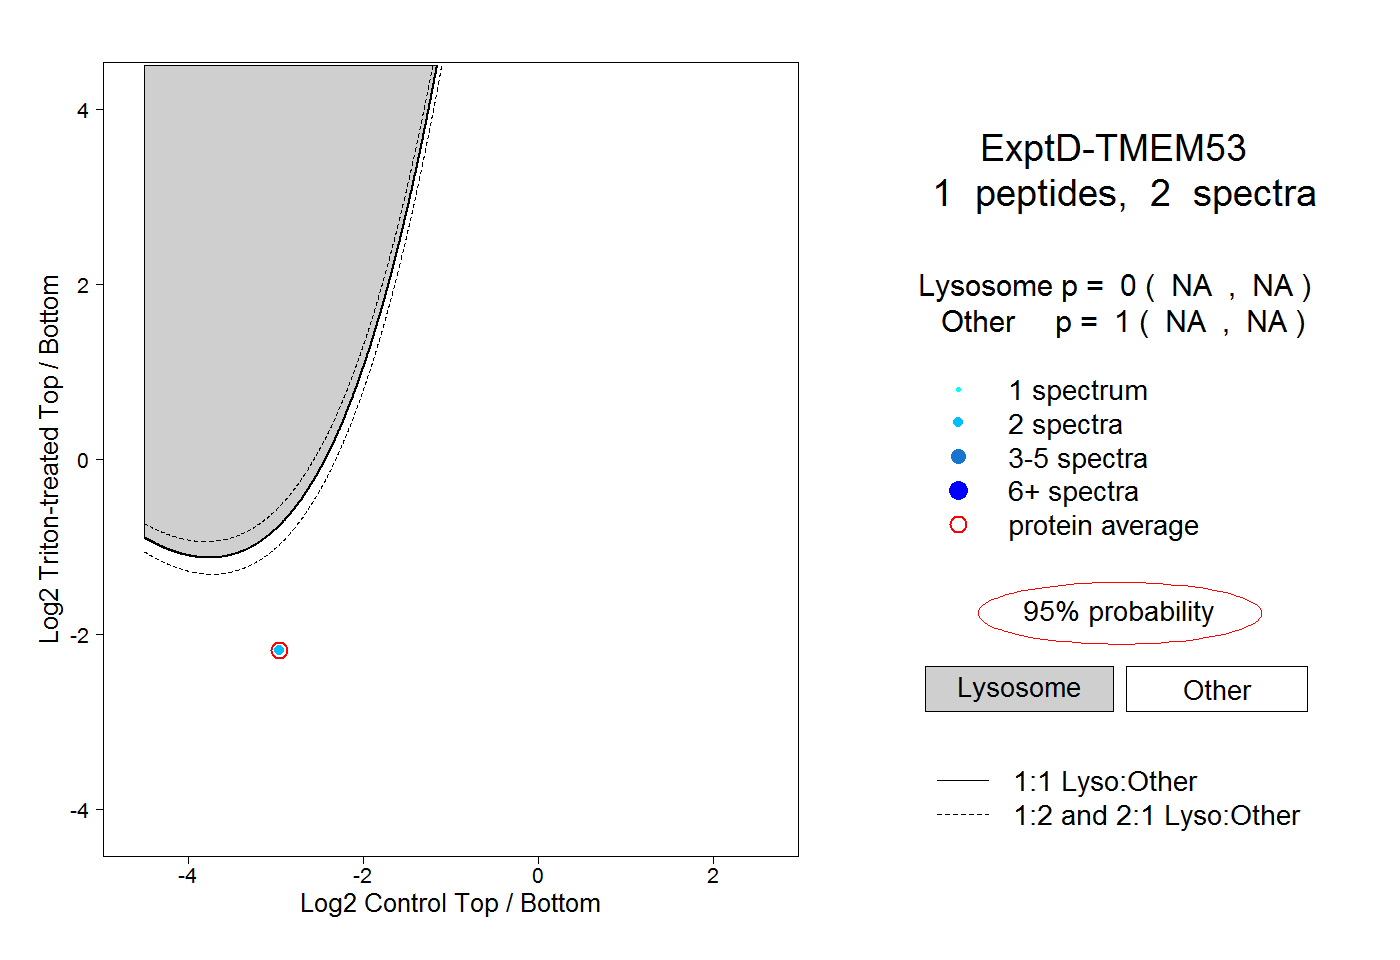
| Expt D |
1
peptide |
2
spectra |
 |
|
0.000
NA | NA |
|
|
|
|
|
|
|
1.000
NA | NA |