 2
2peptides
spectra
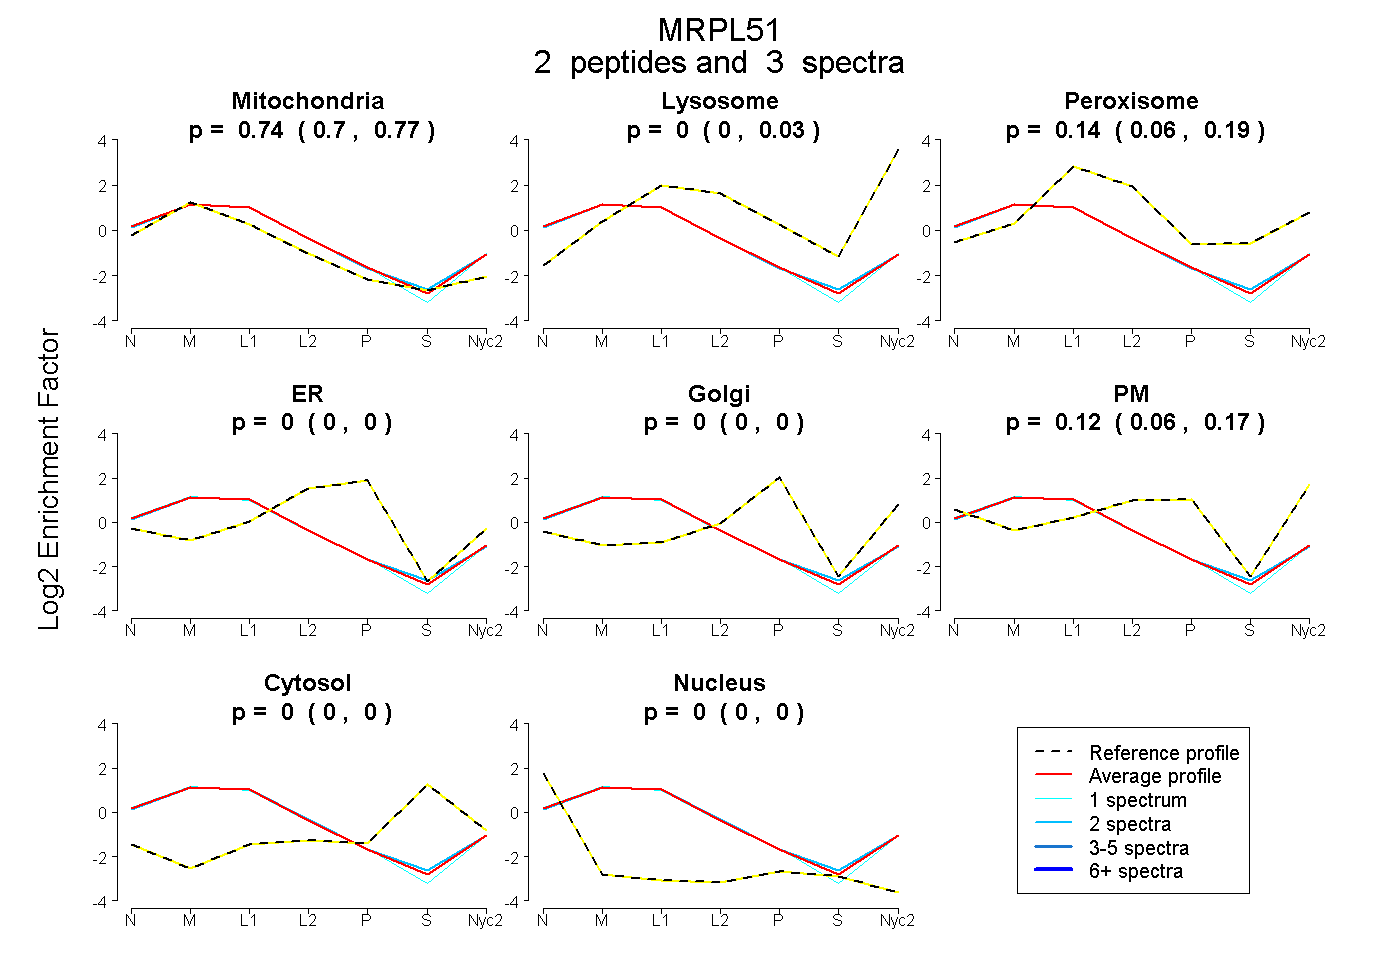
0.699 | 0.775
0.000 | 0.029
0.057 | 0.191
0.000 | 0.000
0.000 | 0.000
0.059 | 0.173
0.000 | 0.000
0.000 | 0.000
1peptide
spectra
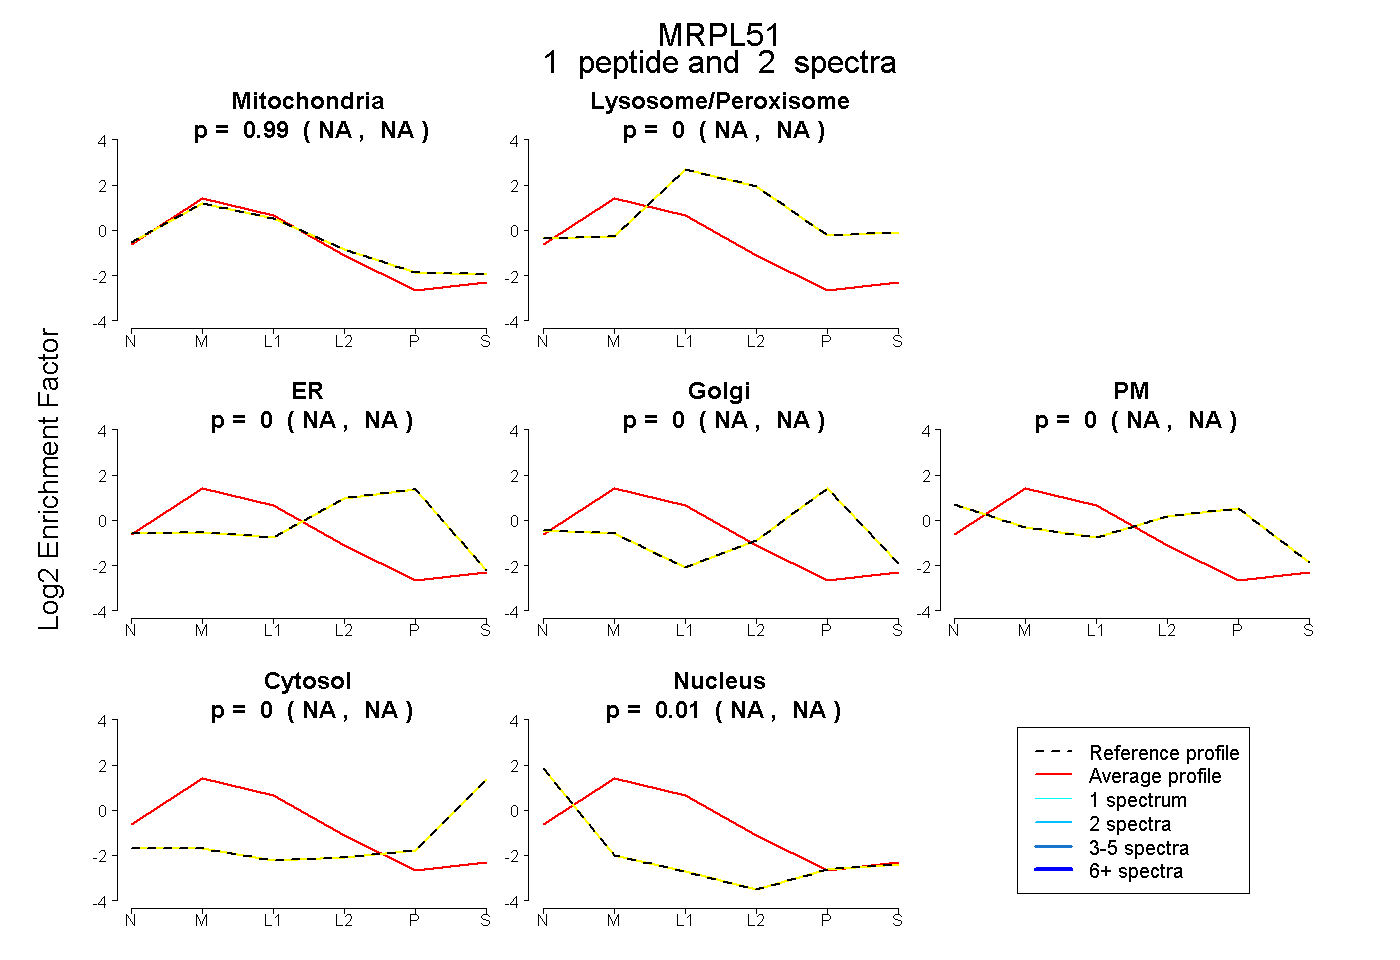
NA | NA
NA | NA
NA | NA
NA | NA
NA | NA
NA | NA
NA | NA
4peptides
spectra
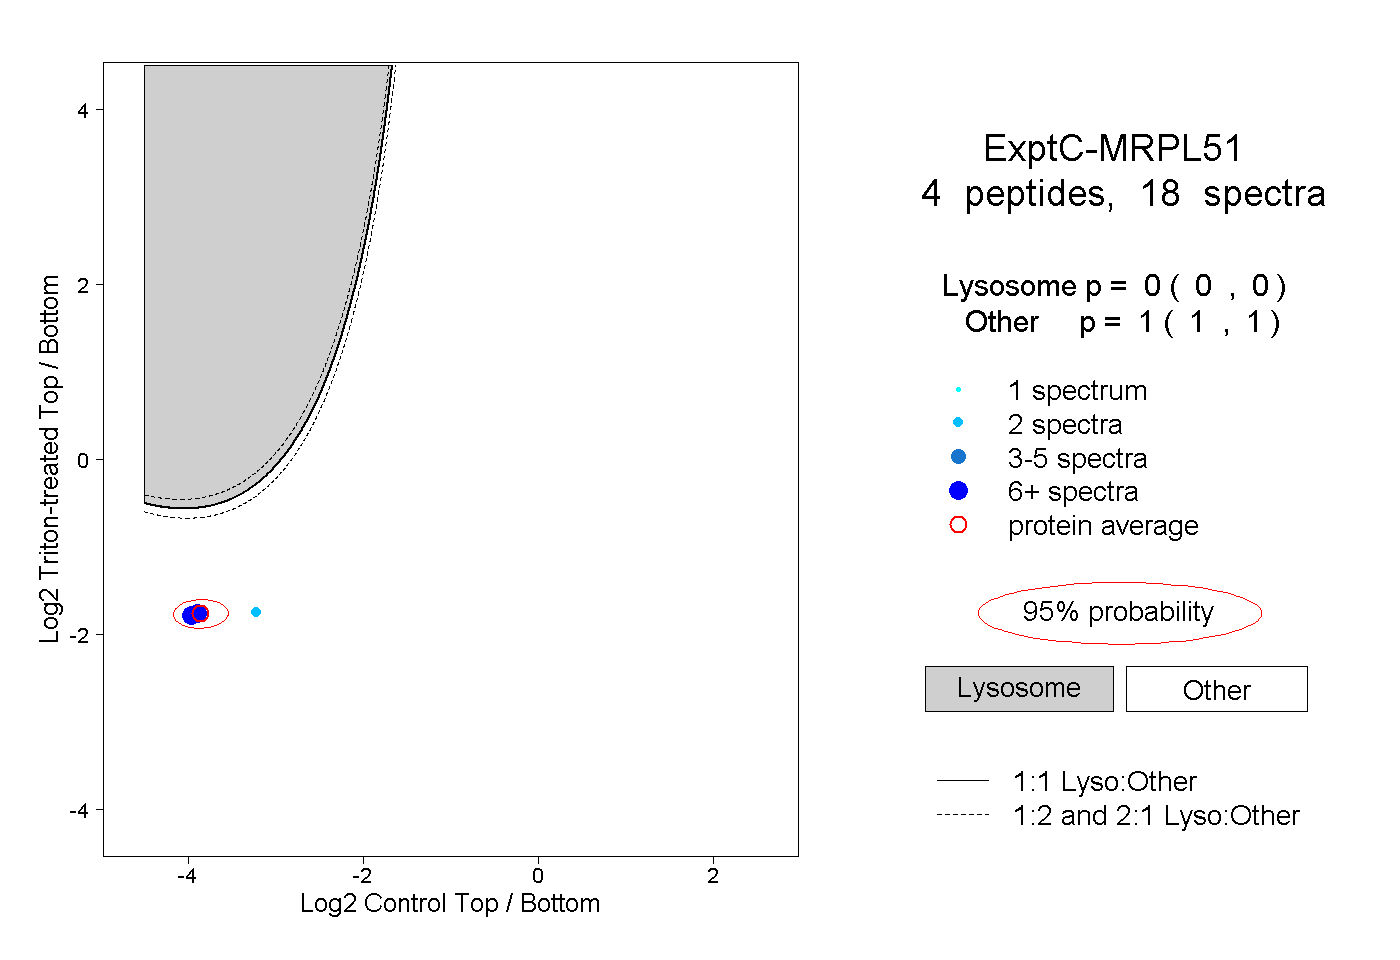
0.000 | 0.000
1.000 | 1.000
1peptide
spectra
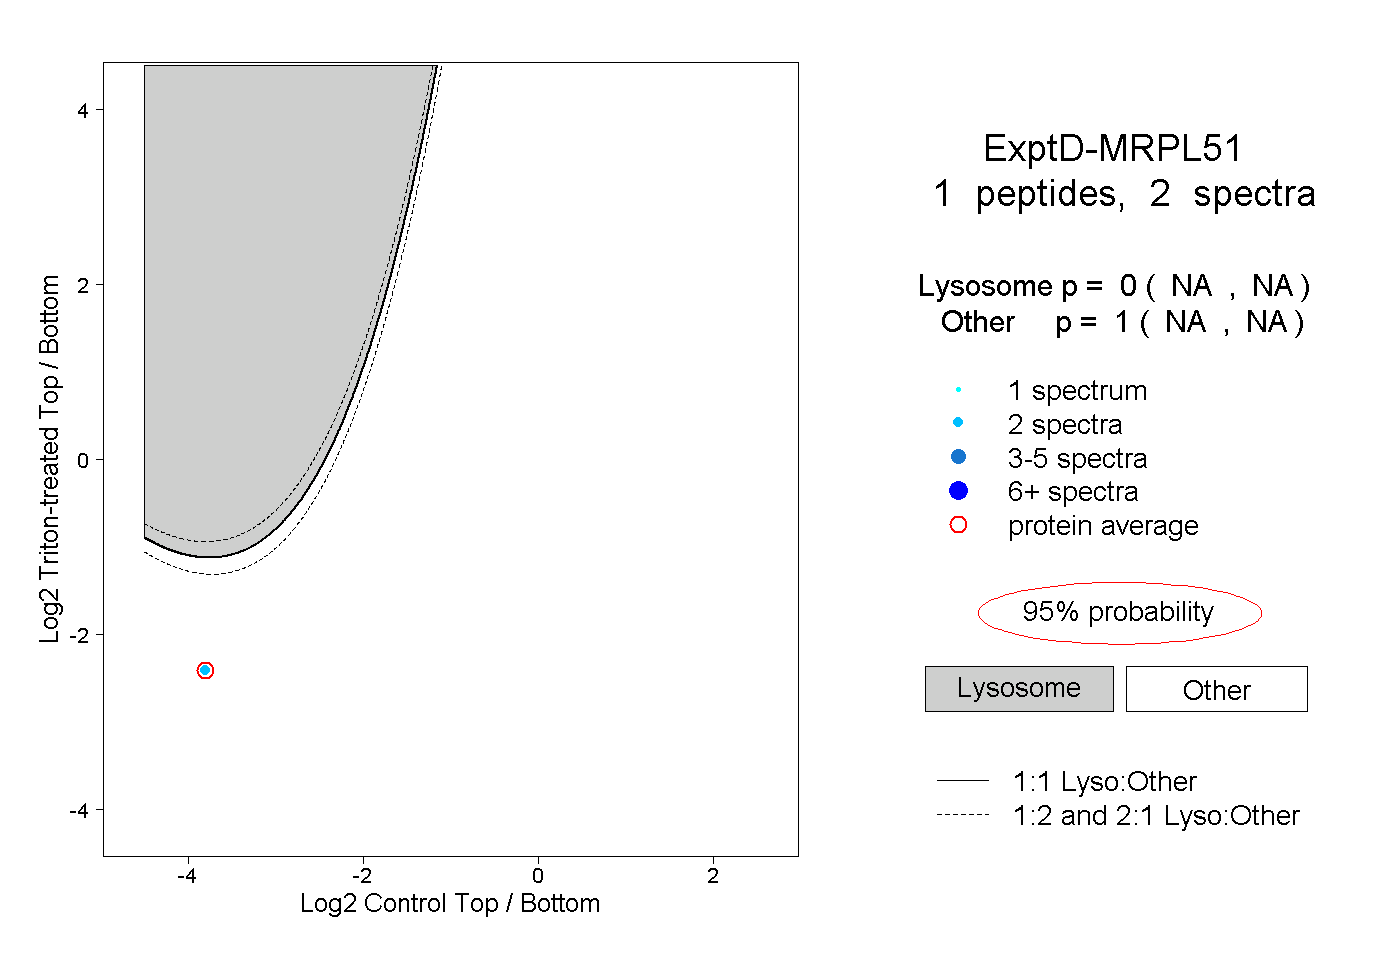
NA | NA
NA | NA