 2
2peptides
spectra
0.699 | 0.775
0.000 | 0.029
0.057 | 0.191
0.000 | 0.000
0.000 | 0.000
0.059 | 0.173
0.000 | 0.000
0.000 | 0.000
| Plot | Mito | Lyso | Perox | ER | Golgi | PM | Cytosol | Nucleus | |||||
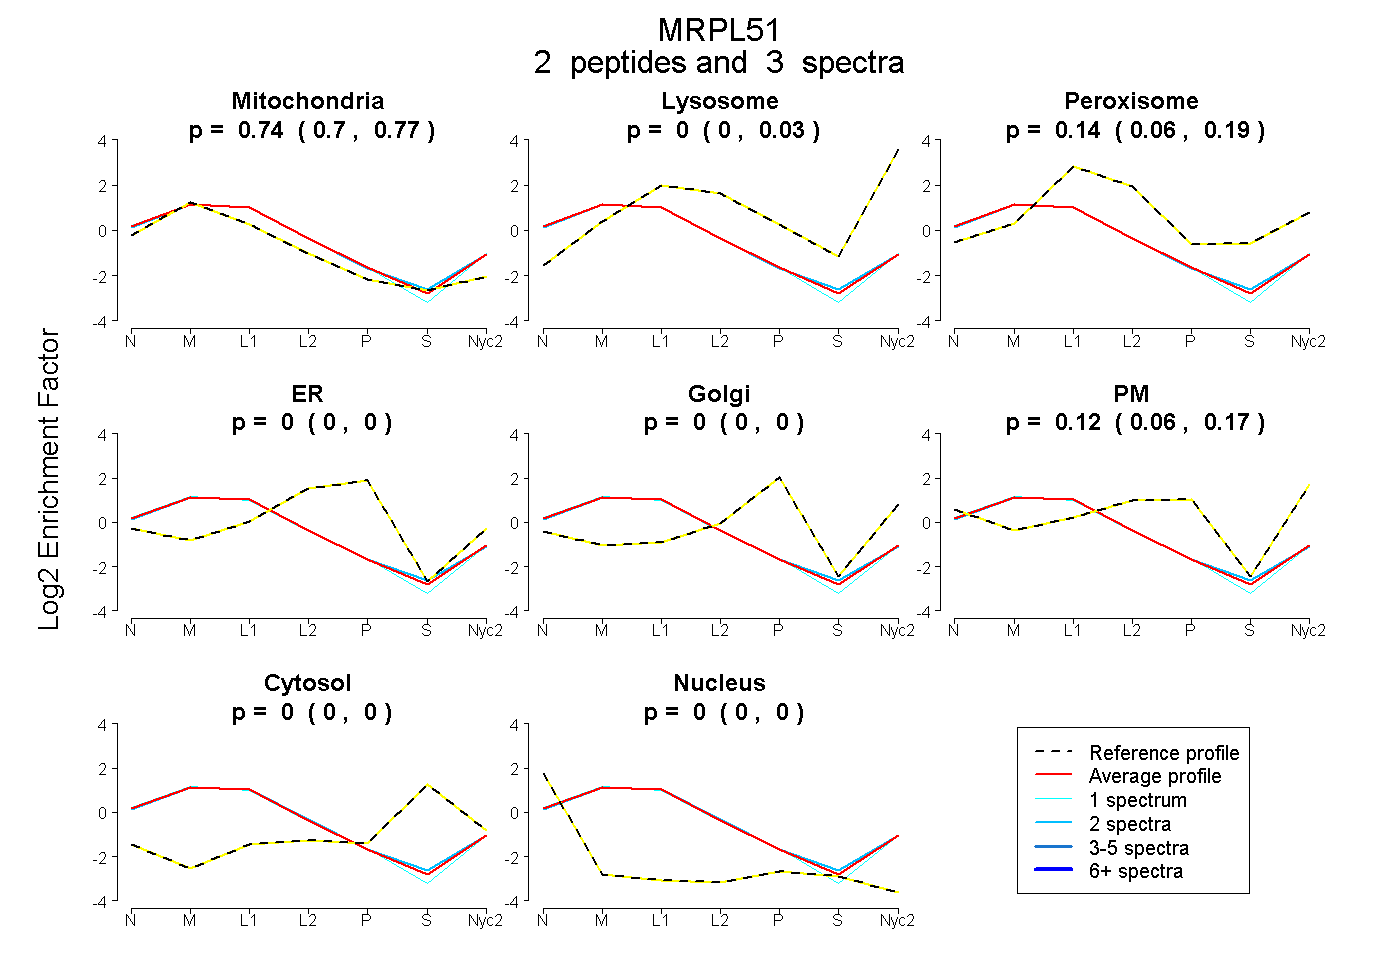
| Expt A |
2 peptides |
3 spectra |
|
0.740 0.699 | 0.775 |
0.000 0.000 | 0.029 |
0.138 0.057 | 0.191 |
0.000 0.000 | 0.000 |
0.000 0.000 | 0.000 |
0.123 0.059 | 0.173 |
0.000 0.000 | 0.000 |
0.000 0.000 | 0.000 |
| 2 spectra, GPVWLR | 0.731 | 0.000 | 0.171 | 0.000 | 0.000 | 0.097 | 0.000 | 0.000 | ||
| 1 spectrum, LTLPPPR | 0.756 | 0.000 | 0.071 | 0.000 | 0.000 | 0.173 | 0.000 | 0.000 |
| Plot | Mito | Lyso or Perox | ER | Golgi | PM | Cytosol | Nucleus | ||||||
| Expt B |
1 peptide |
2 spectra |
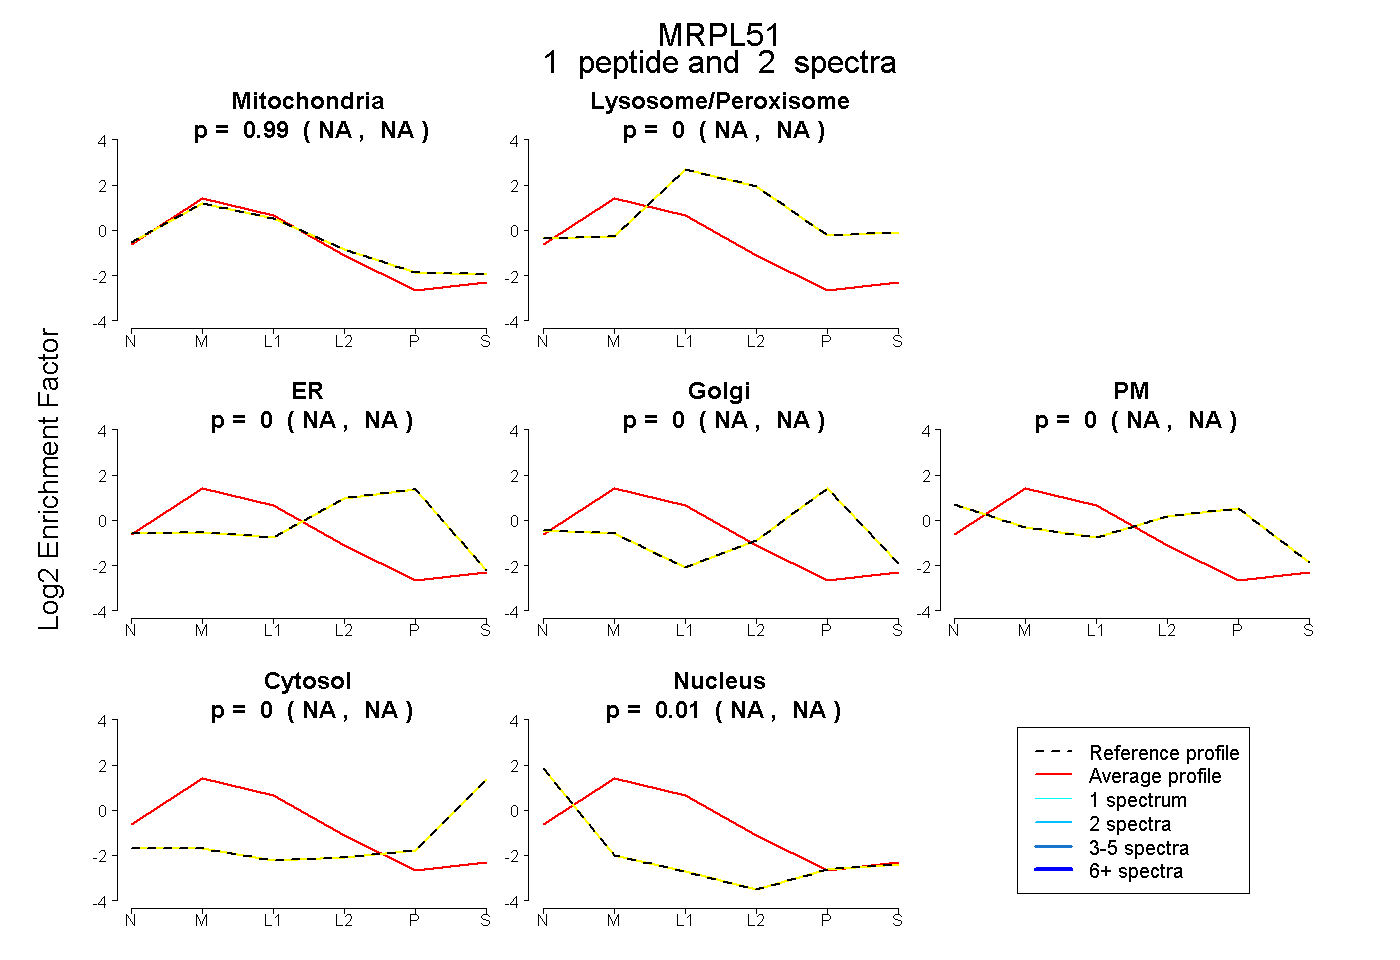 |
0.993 NA | NA |
0.000 NA | NA |
0.000 NA | NA |
0.000 NA | NA |
0.000 NA | NA |
0.000 NA | NA |
0.007 NA | NA |
|||
| Plot | Lyso | Other | |||||||||||
| Expt C |
4 peptides |
18 spectra |
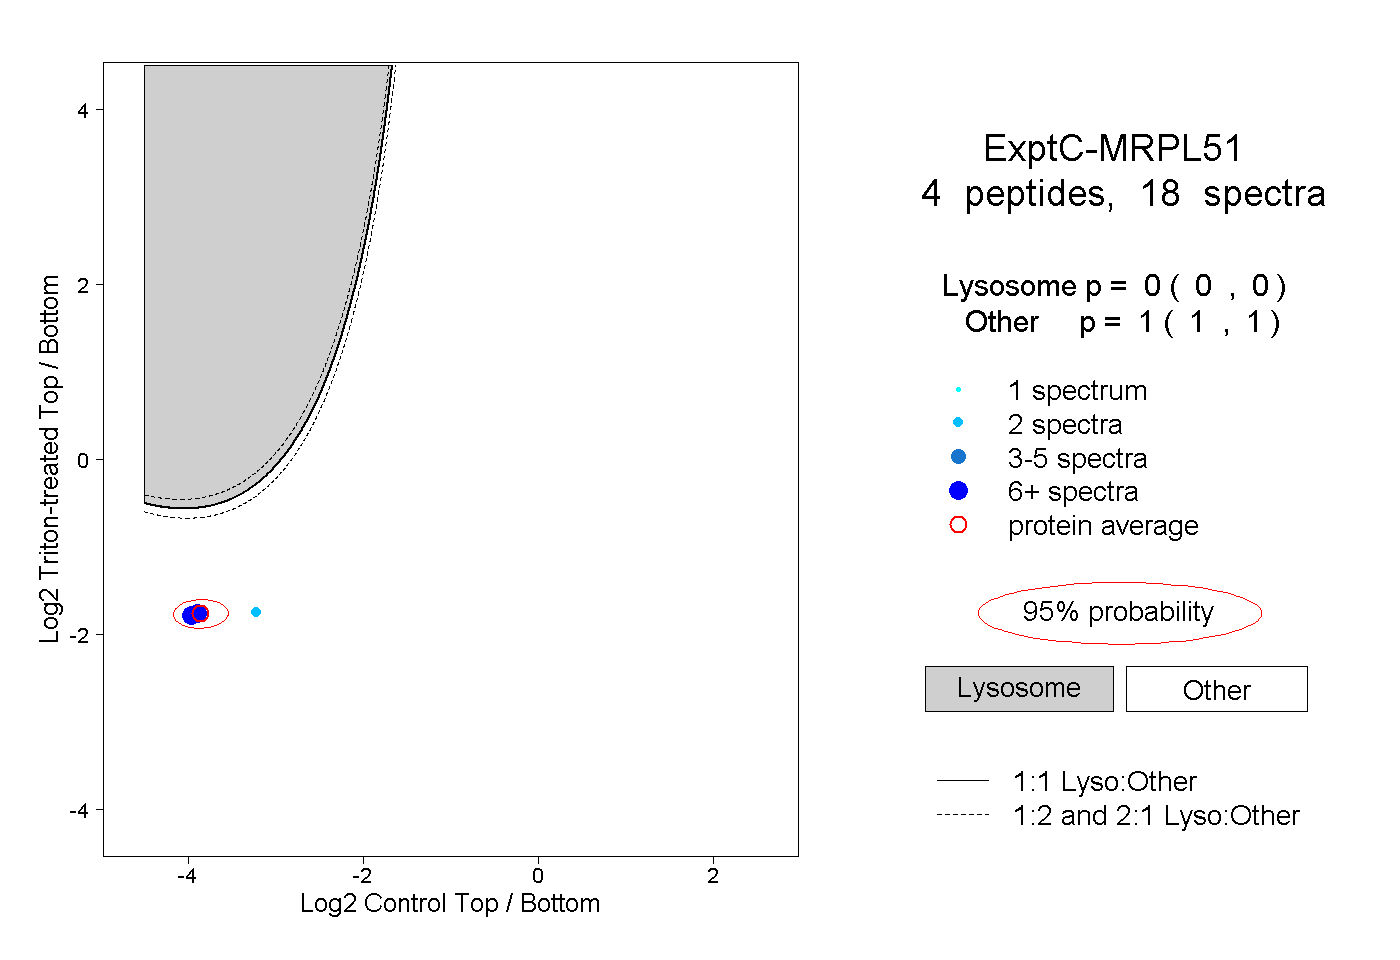 |
0.000 0.000 | 0.000 |
1.000 1.000 | 1.000 |
||||||||
| Plot | Lyso | Other | |||||||||||
| Expt D |
1 peptide |
2 spectra |
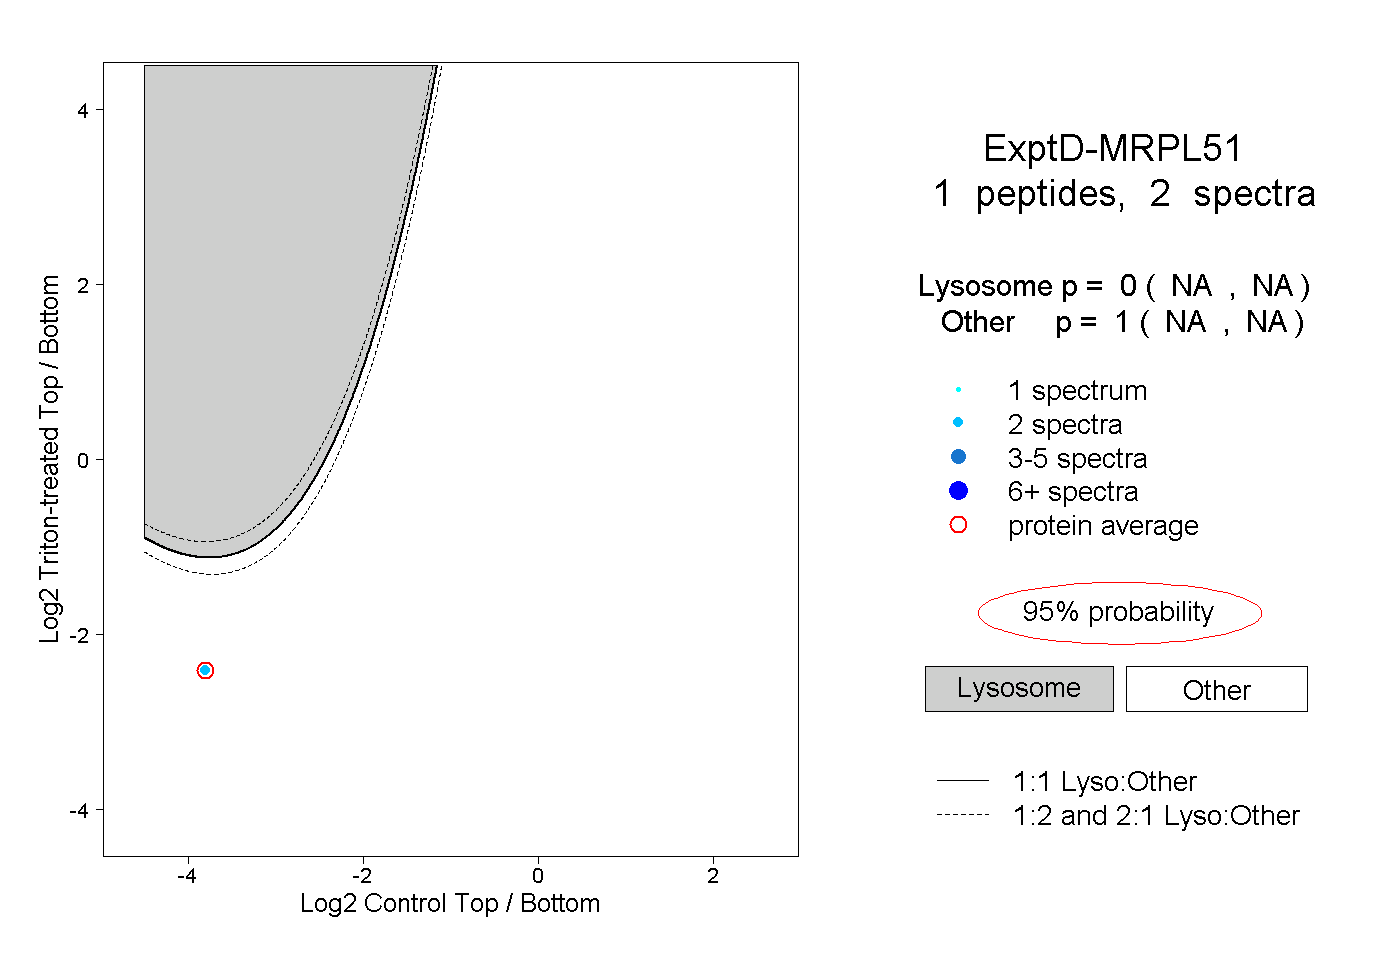 |
0.000 NA | NA |
1.000 NA | NA |