 11
11peptides
spectra
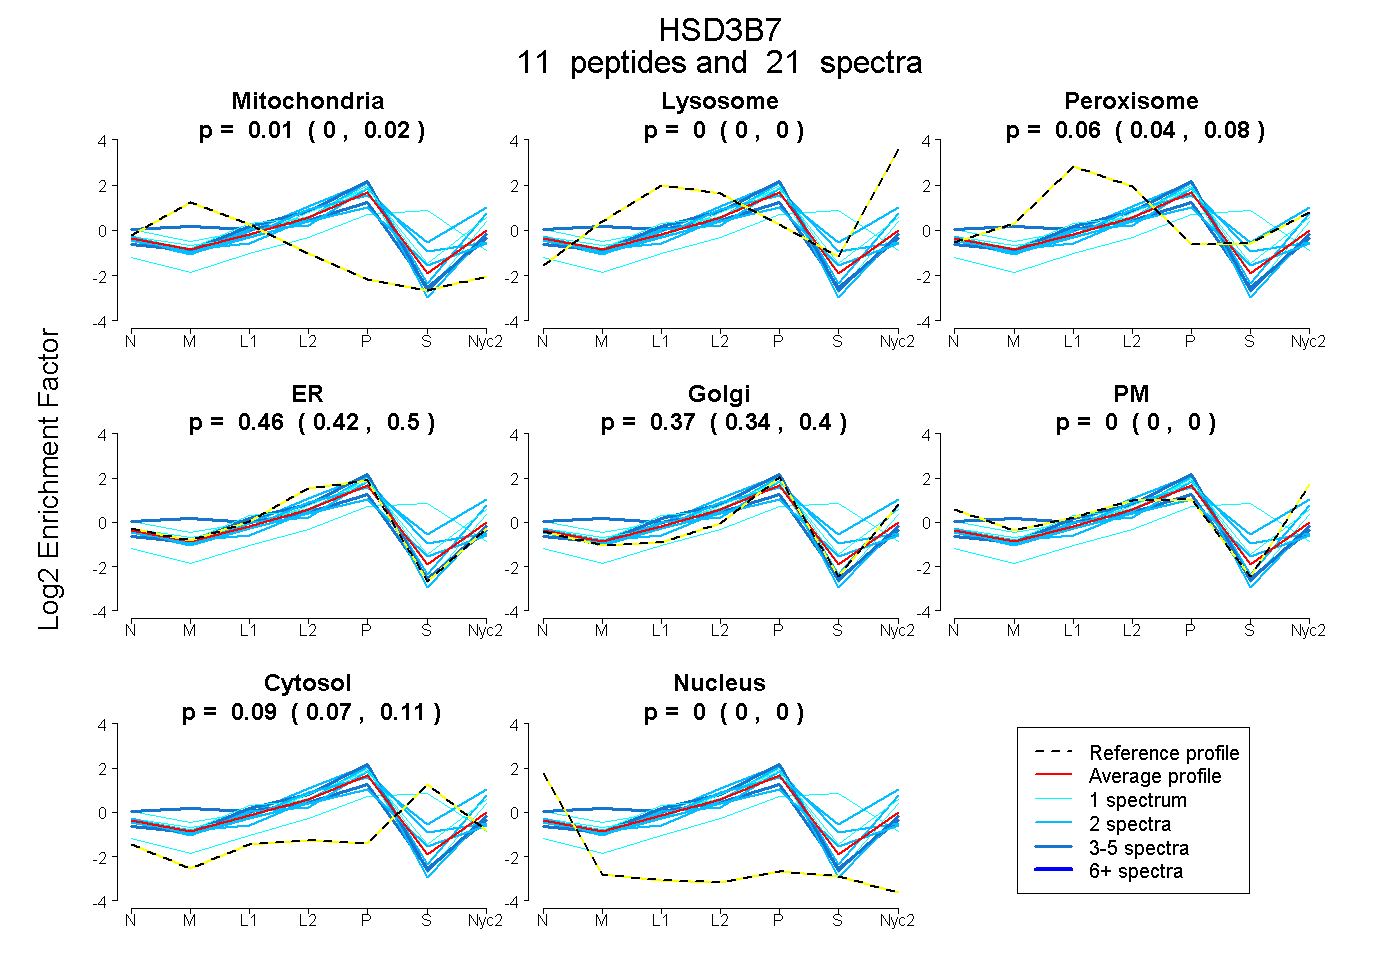
0.000 | 0.024
0.000 | 0.000
0.043 | 0.079
0.425 | 0.498
0.335 | 0.404
0.000 | 0.000
0.071 | 0.108
0.000 | 0.000
2peptides
spectra
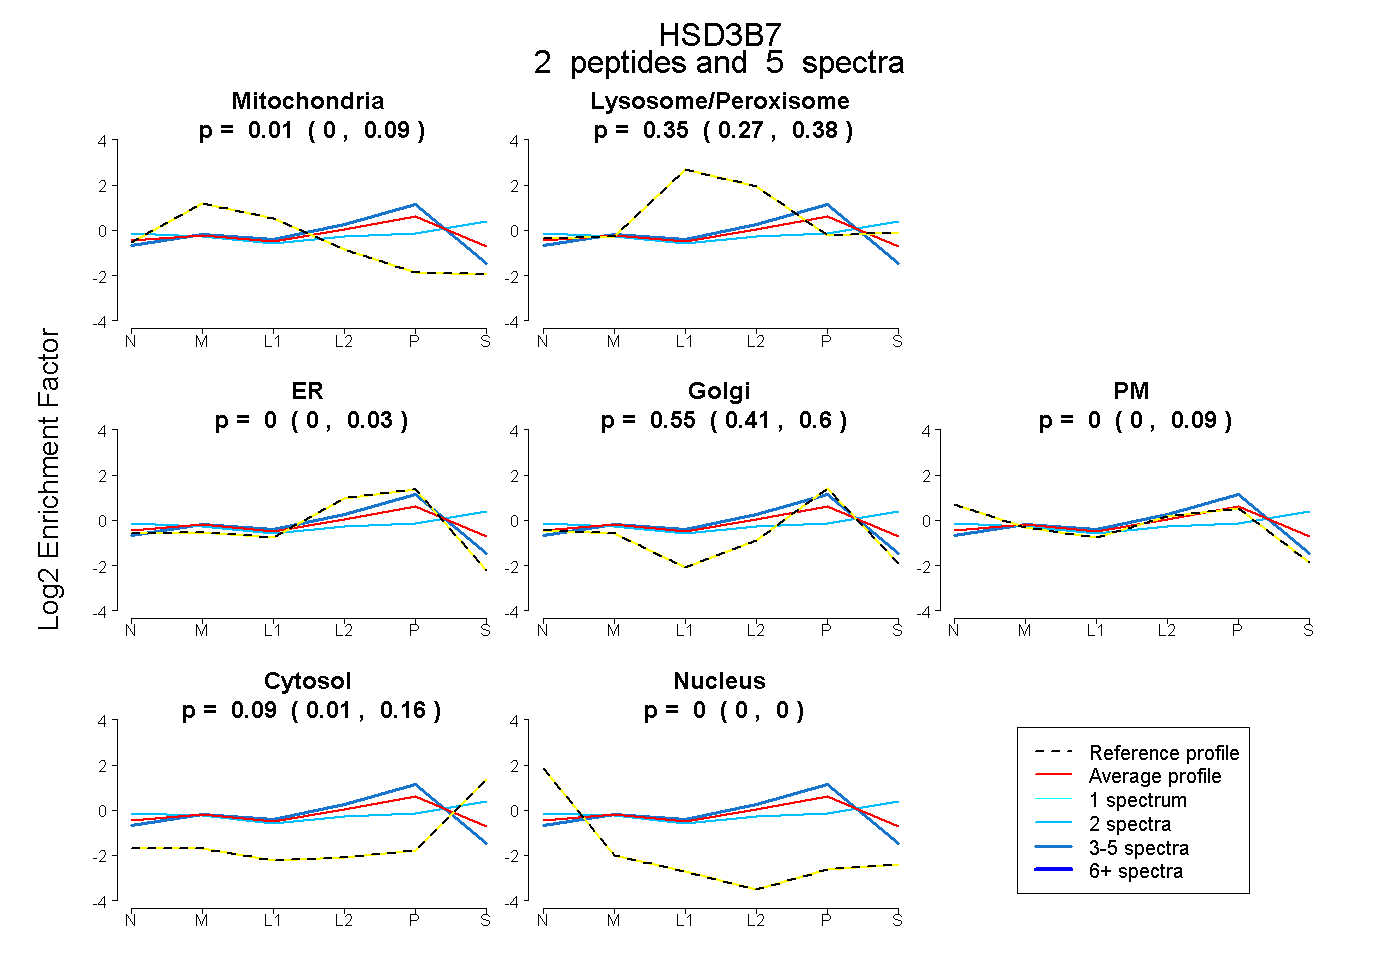
0.000 | 0.086
0.268 | 0.384
0.000 | 0.026
0.414 | 0.604
0.000 | 0.085
0.011 | 0.159
0.000 | 0.000
6peptides
spectra
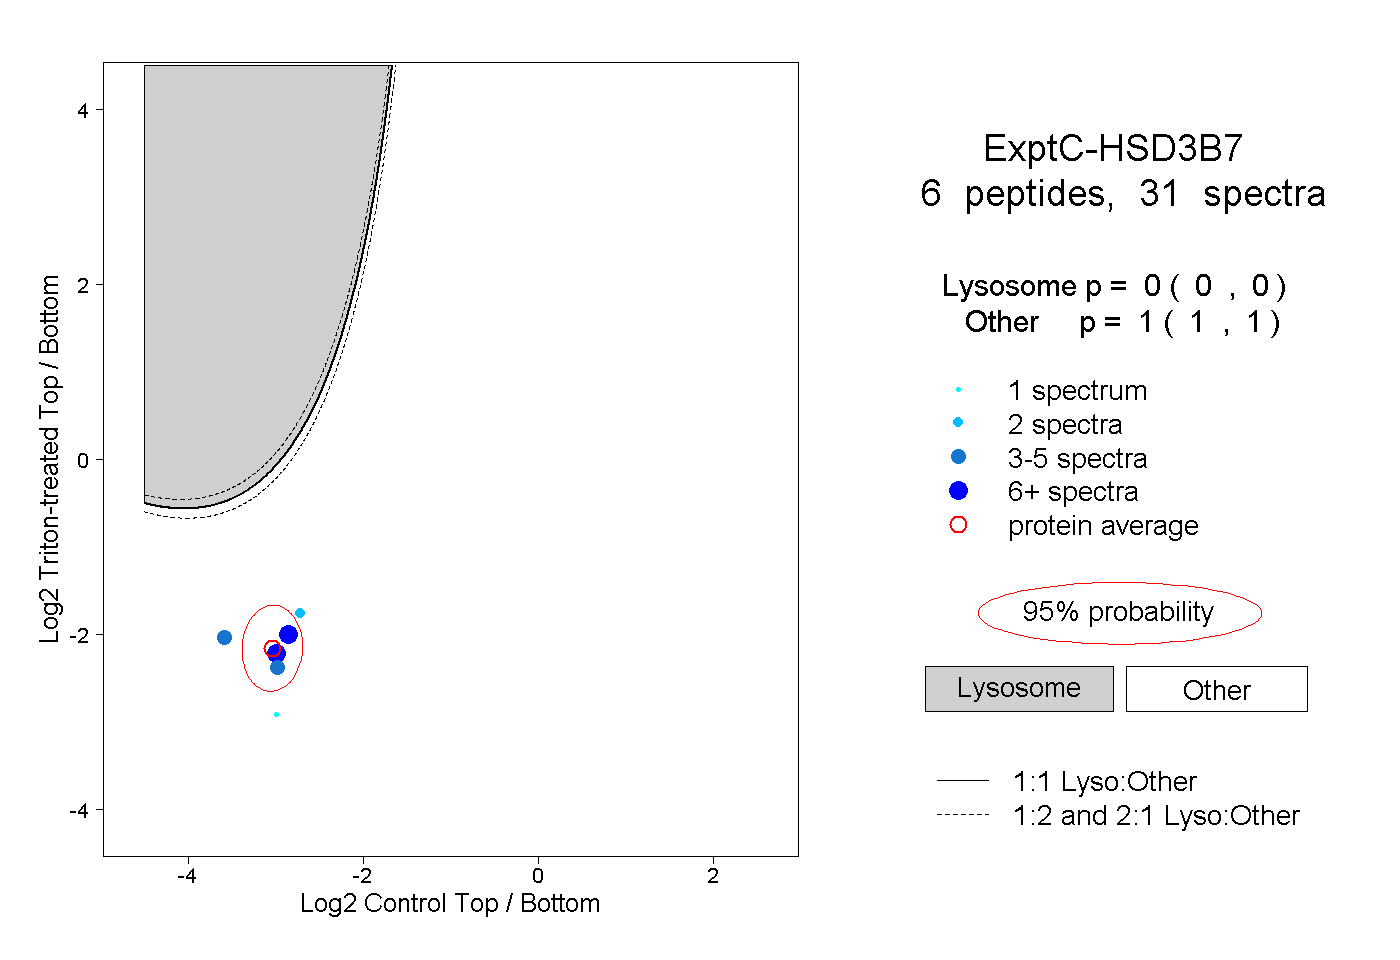
0.000 | 0.000
1.000 | 1.000
1peptide
spectrum
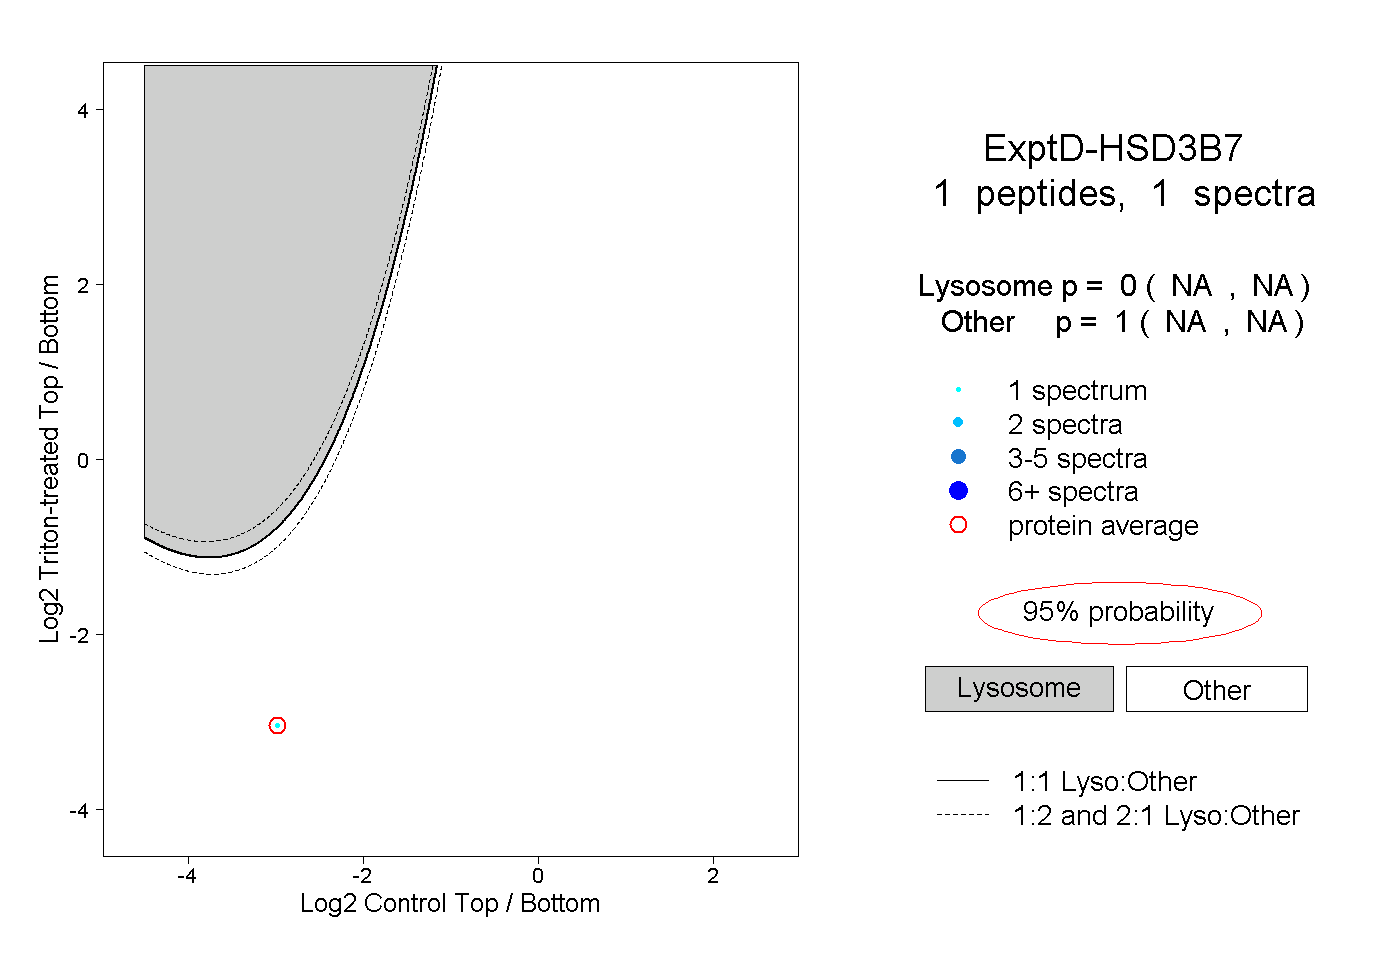
NA | NA
NA | NA