 11
11peptides
spectra
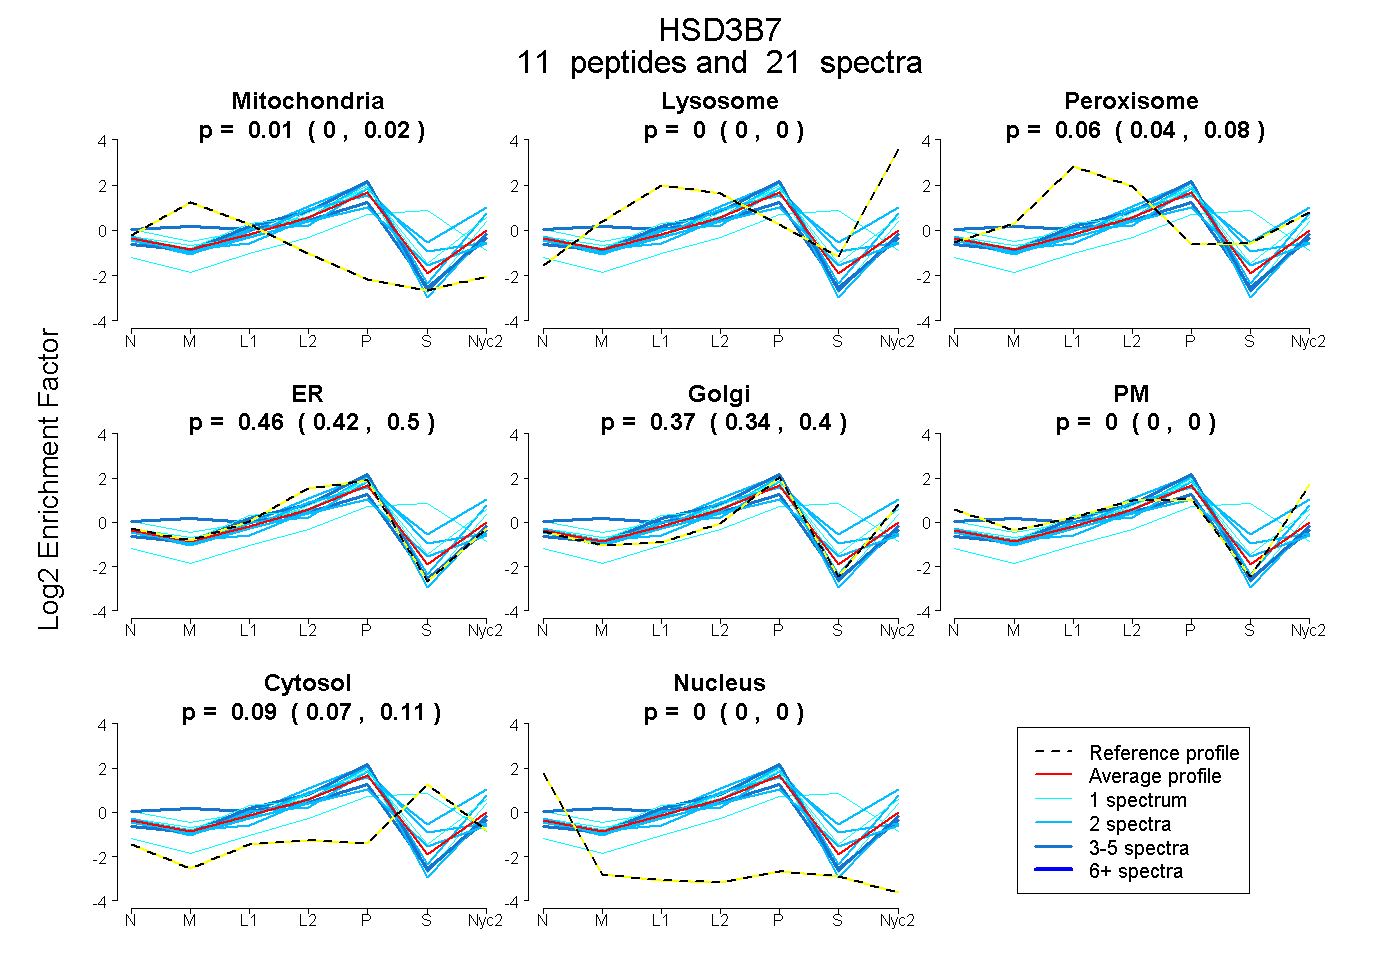
0.000 | 0.024
0.000 | 0.000
0.043 | 0.079
0.425 | 0.498
0.335 | 0.404
0.000 | 0.000
0.071 | 0.108
0.000 | 0.000
| Plot | Mito | Lyso | Perox | ER | Golgi | PM | Cytosol | Nucleus | |||||
| Expt A |
11 peptides |
21 spectra |
|
0.008 0.000 | 0.024 |
0.000 0.000 | 0.000 |
0.064 0.043 | 0.079 |
0.464 0.425 | 0.498 |
0.372 0.335 | 0.404 |
0.000 0.000 | 0.000 |
0.092 0.071 | 0.108 |
0.000 0.000 | 0.000 |
| 4 spectra, GNEDTPYEAIHR | 0.239 | 0.000 | 0.000 | 0.466 | 0.180 | 0.115 | 0.000 | 0.000 | ||
| 2 spectra, HPYPCSK | 0.000 | 0.000 | 0.053 | 0.510 | 0.204 | 0.000 | 0.233 | 0.000 | ||
| 2 spectra, ALAEQLVLEANGR | 0.000 | 0.108 | 0.000 | 0.492 | 0.400 | 0.000 | 0.000 | 0.000 | ||
| 2 spectra, VNVQGTQNVIDACVQTGTR | 0.058 | 0.000 | 0.014 | 0.587 | 0.097 | 0.000 | 0.224 | 0.020 | ||
| 1 spectrum, ASPETIHK | 0.000 | 0.000 | 0.000 | 0.311 | 0.014 | 0.000 | 0.675 | 0.000 | ||
| 1 spectrum, SYEDFNMEFLSPCGLR | 0.000 | 0.000 | 0.123 | 0.444 | 0.393 | 0.000 | 0.040 | 0.000 | ||
| 3 spectra, MLLEWEPR | 0.009 | 0.000 | 0.000 | 0.733 | 0.258 | 0.000 | 0.000 | 0.000 | ||
| 1 spectrum, TIHWVQAMEGSAW | 0.000 | 0.047 | 0.099 | 0.285 | 0.509 | 0.000 | 0.059 | 0.000 | ||
| 2 spectra, HFGYKPLFSWEESR | 0.000 | 0.000 | 0.000 | 0.514 | 0.448 | 0.000 | 0.000 | 0.039 | ||
| 2 spectra, VYVGNVAWMHILVAR | 0.000 | 0.197 | 0.000 | 0.241 | 0.239 | 0.116 | 0.206 | 0.000 | ||
| 1 spectrum, GHPFYR | 0.047 | 0.000 | 0.000 | 0.414 | 0.305 | 0.234 | 0.000 | 0.000 |
| Plot | Mito | Lyso or Perox | ER | Golgi | PM | Cytosol | Nucleus | ||||||
| Expt B |
2 peptides |
5 spectra |
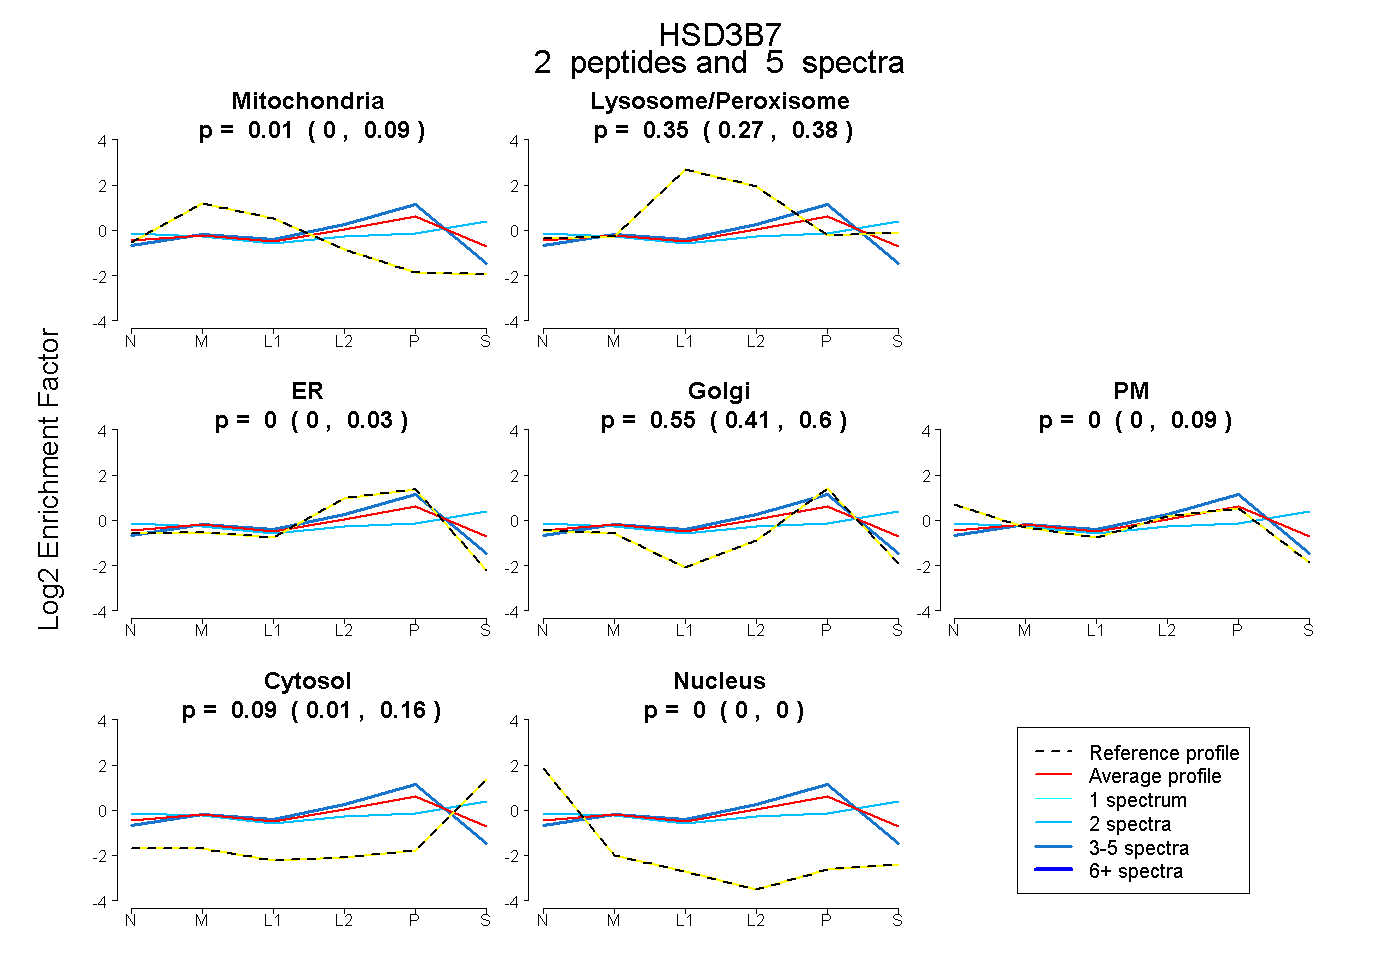 |
0.009 0.000 | 0.086 |
0.355 0.268 | 0.384 |
0.000 0.000 | 0.026 |
0.546 0.414 | 0.604 |
0.000 0.000 | 0.085 |
0.090 0.011 | 0.159 |
0.000 0.000 | 0.000 |
|||
| Plot | Lyso | Other | |||||||||||
| Expt C |
6 peptides |
31 spectra |
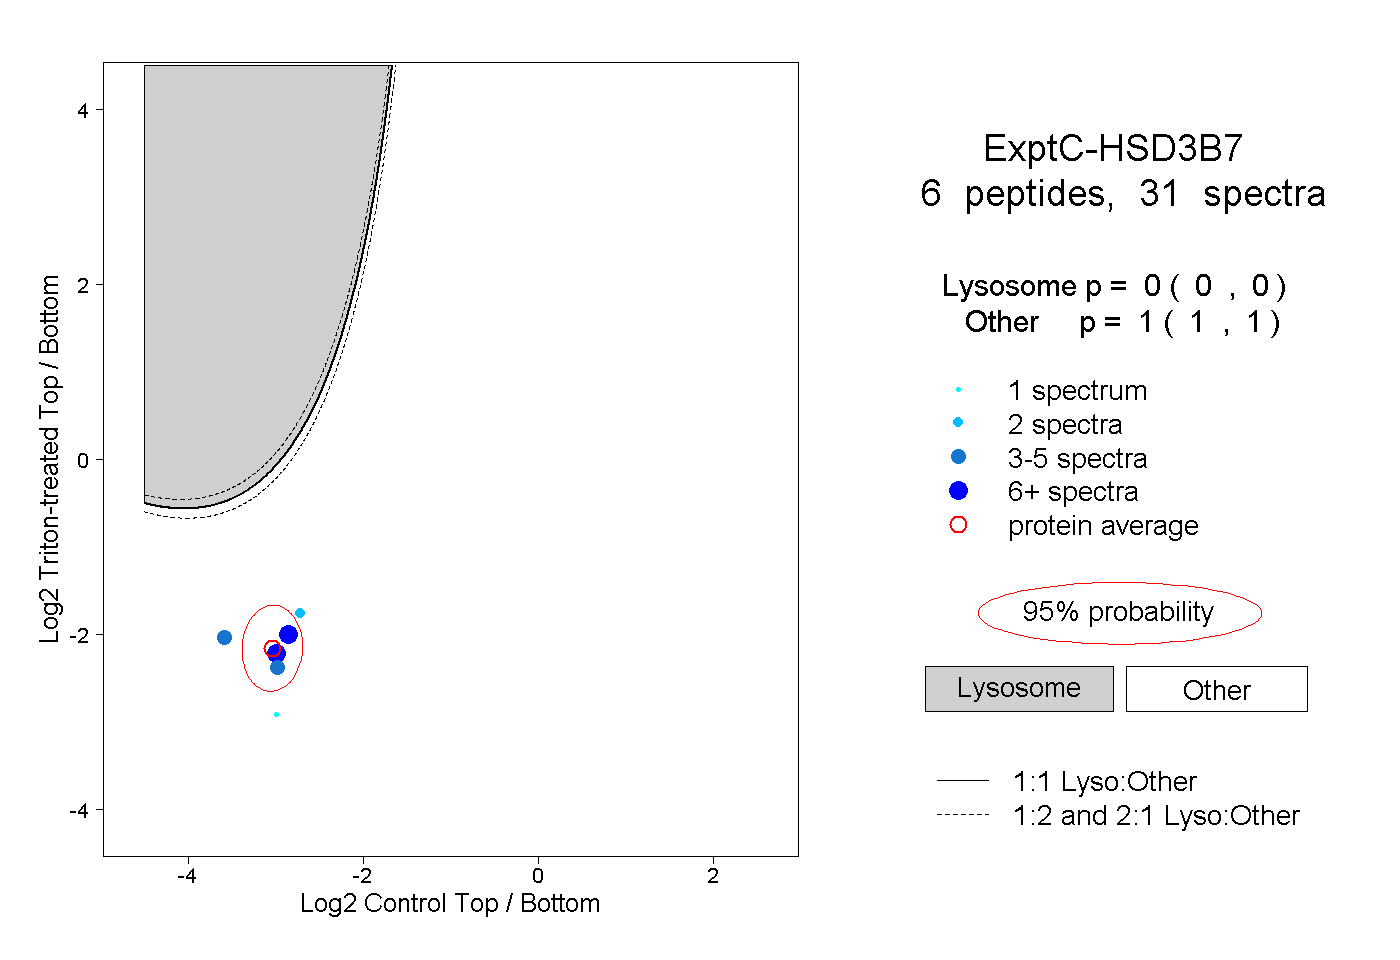 |
0.000 0.000 | 0.000 |
1.000 1.000 | 1.000 |
||||||||
| Plot | Lyso | Other | |||||||||||
| Expt D |
1 peptide |
1 spectrum |
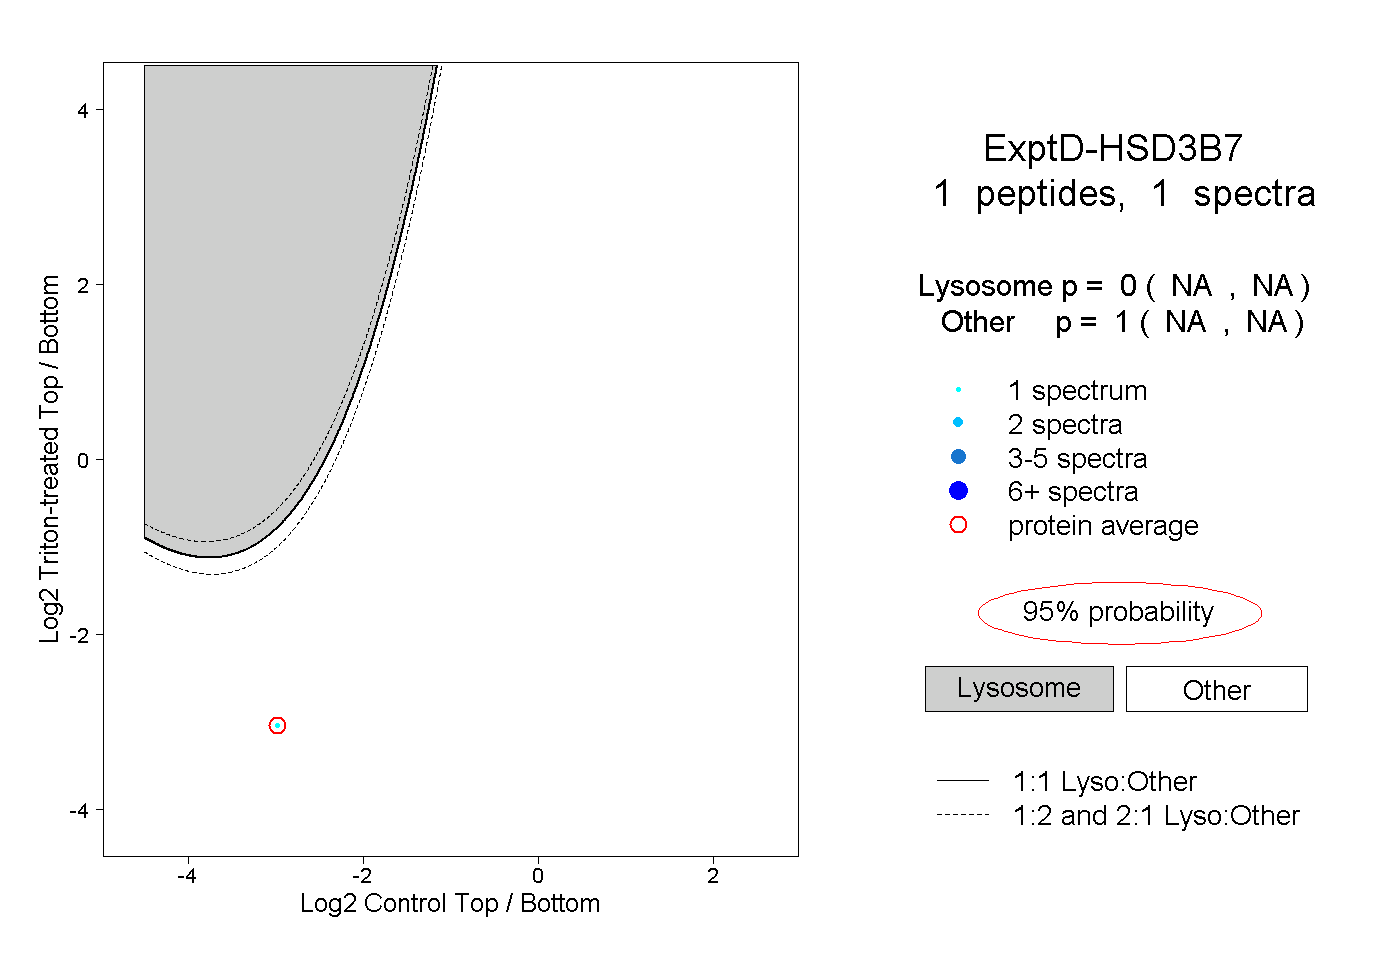 |
0.000 NA | NA |
1.000 NA | NA |