 13
13peptides
spectra
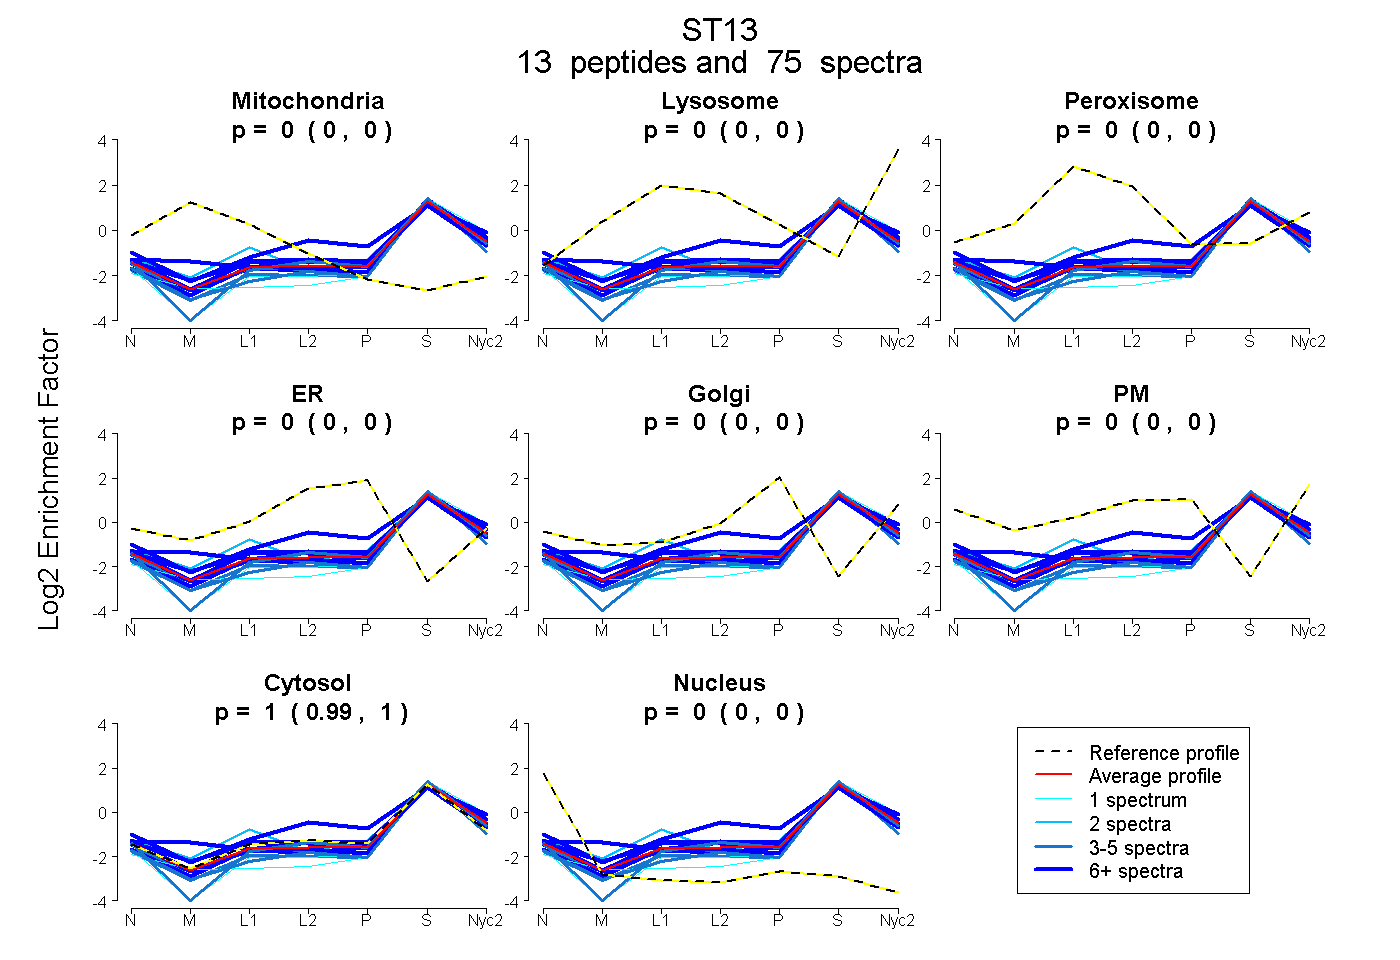
0.000 | 0.000
0.000 | 0.000
0.000 | 0.000
0.000 | 0.000
0.000 | 0.000
0.000 | 0.000
0.995 | 1.000
0.000 | 0.005
5peptides
spectra
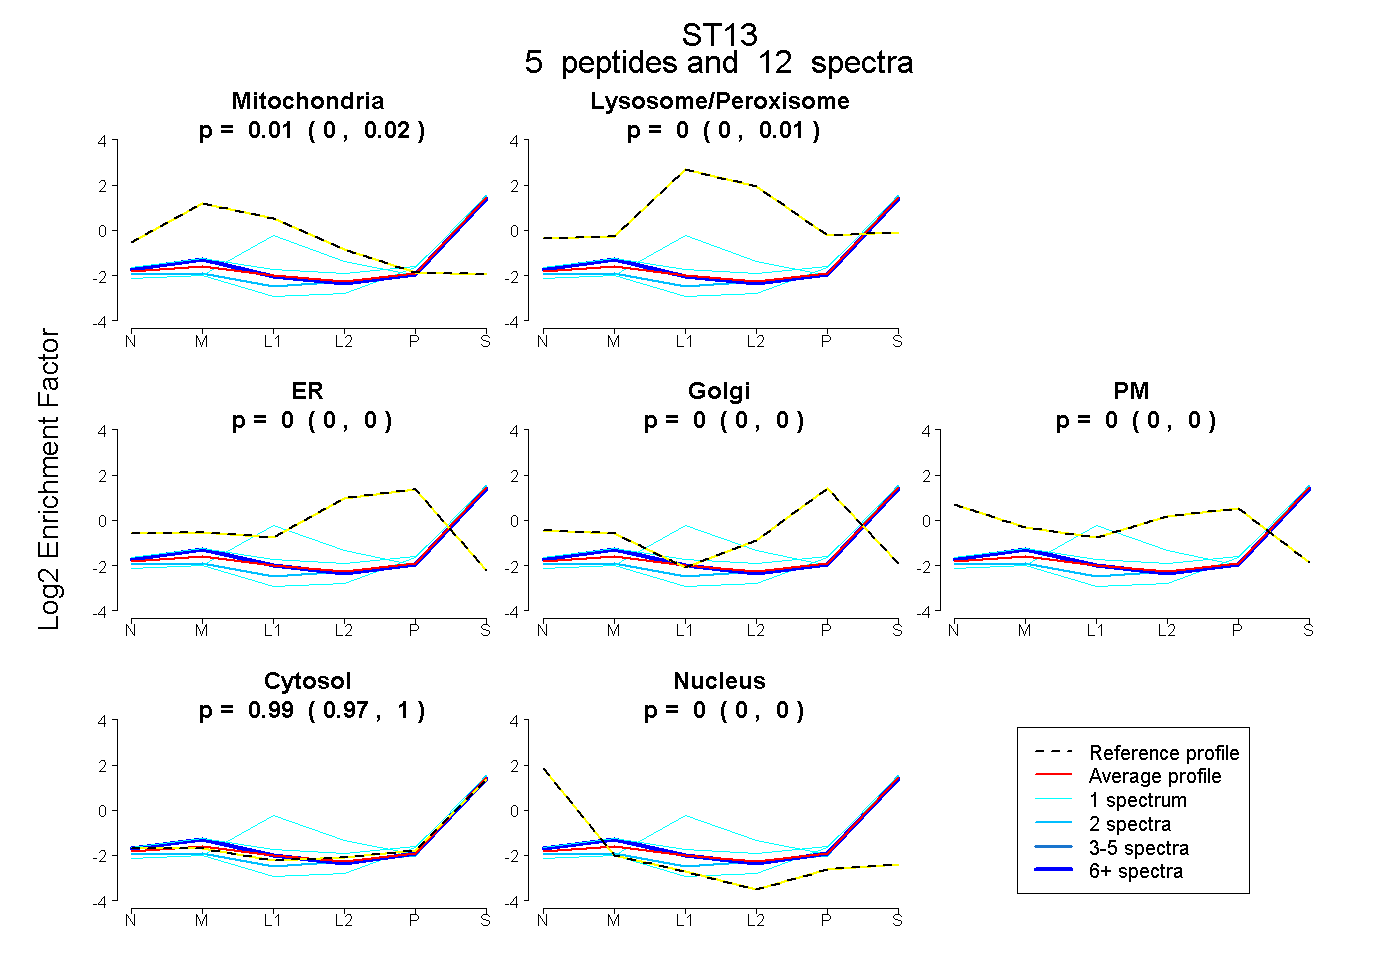
0.000 | 0.022
0.000 | 0.011
0.000 | 0.000
0.000 | 0.000
0.000 | 0.000
0.972 | 1.000
0.000 | 0.000
12peptides
spectra
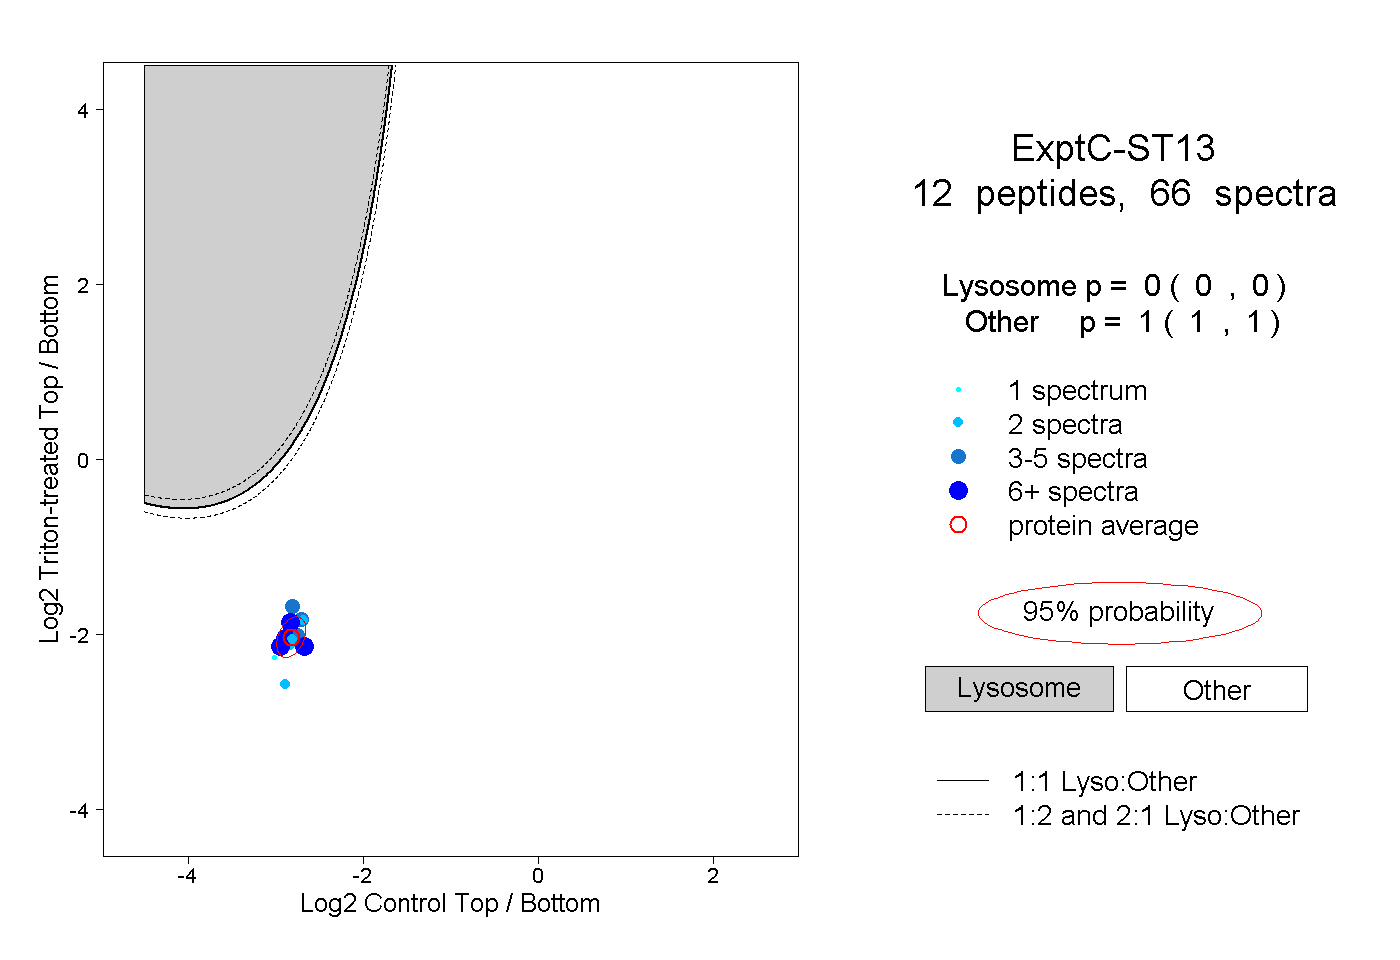
0.000 | 0.000
1.000 | 1.000
2peptides
spectra
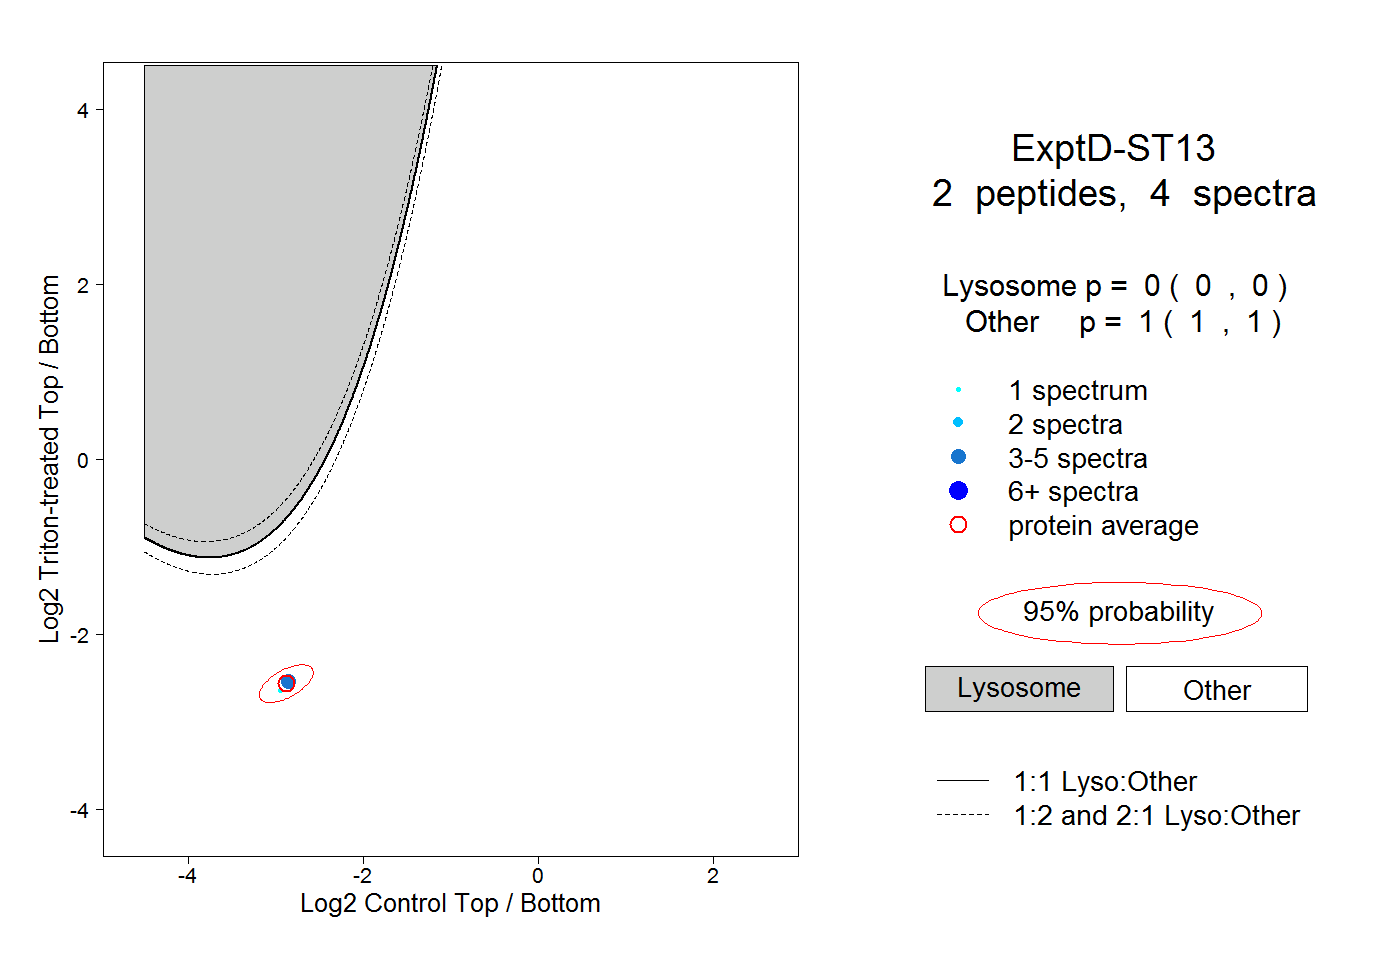
0.000 | 0.000
1.000 | 1.000