 13
13peptides
spectra
0.000 | 0.000
0.000 | 0.000
0.000 | 0.000
0.000 | 0.000
0.000 | 0.000
0.000 | 0.000
0.995 | 1.000
0.000 | 0.005
| Plot | Mito | Lyso | Perox | ER | Golgi | PM | Cytosol | Nucleus | |||||
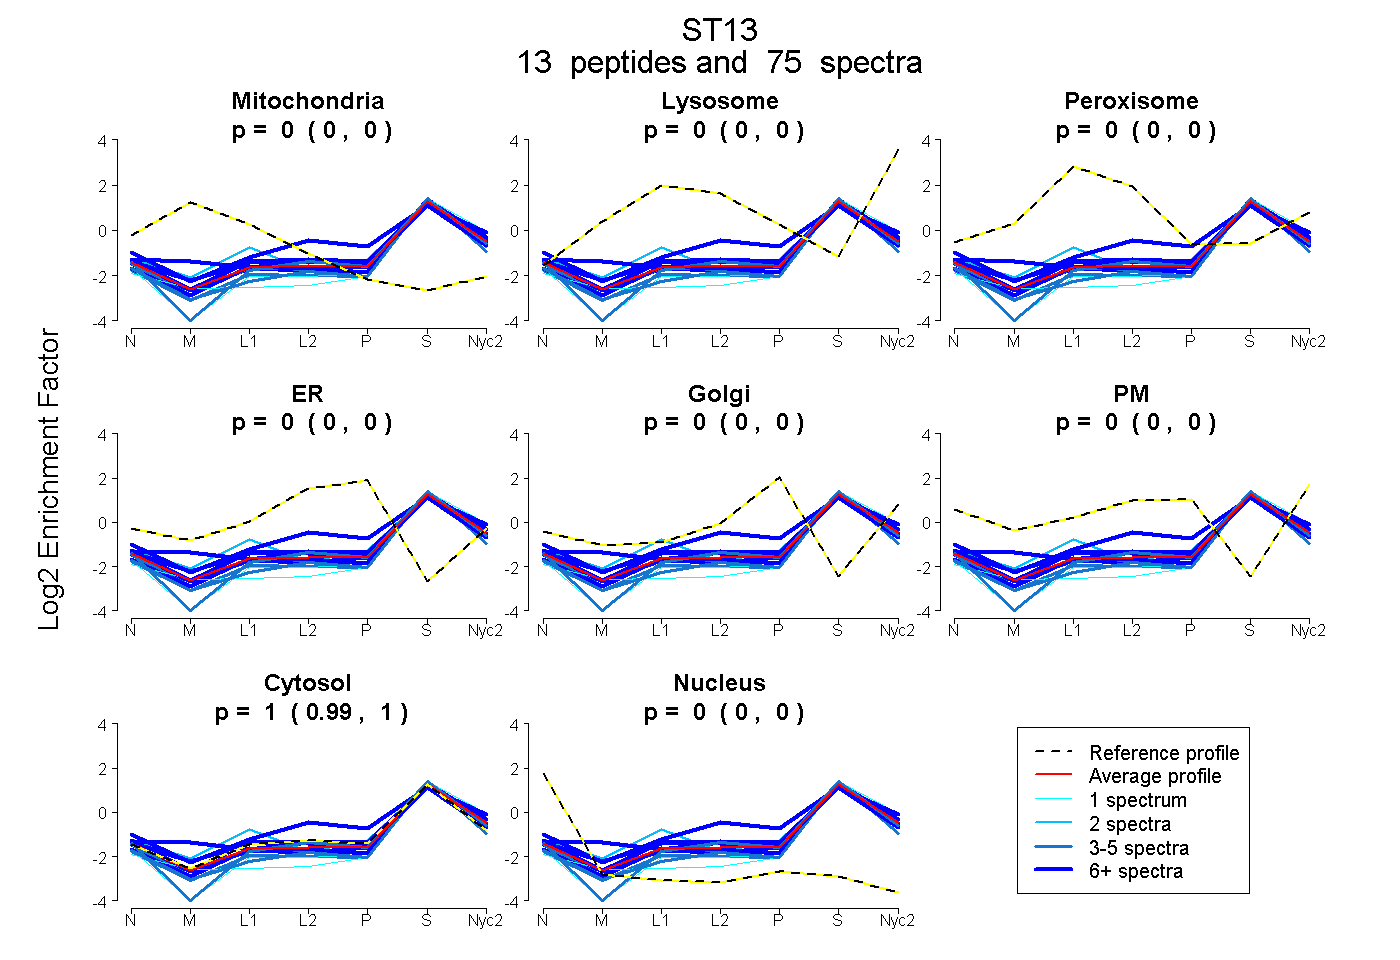
| Expt A |
13 peptides |
75 spectra |
|
0.000 0.000 | 0.000 |
0.000 0.000 | 0.000 |
0.000 0.000 | 0.000 |
0.000 0.000 | 0.000 |
0.000 0.000 | 0.000 |
0.000 0.000 | 0.000 |
0.997 0.995 | 1.000 |
0.003 0.000 | 0.005 |
| 5 spectra, LAILYAK | 0.000 | 0.000 | 0.000 | 0.000 | 0.000 | 0.000 | 0.979 | 0.021 | ||
| 3 spectra, LQKPNAAIR | 0.000 | 0.000 | 0.000 | 0.000 | 0.000 | 0.000 | 0.951 | 0.049 | ||
| 2 spectra, ASVFVK | 0.042 | 0.053 | 0.004 | 0.000 | 0.000 | 0.000 | 0.901 | 0.000 | ||
| 1 spectrum, GAAIDALNDGELQK | 0.000 | 0.000 | 0.000 | 0.000 | 0.000 | 0.000 | 0.971 | 0.029 | ||
| 3 spectra, YQNNPK | 0.000 | 0.000 | 0.000 | 0.000 | 0.000 | 0.000 | 0.996 | 0.004 | ||
| 11 spectra, EWVESMGGK | 0.000 | 0.000 | 0.000 | 0.000 | 0.000 | 0.000 | 1.000 | 0.000 | ||
| 8 spectra, VPPATHK | 0.121 | 0.013 | 0.000 | 0.000 | 0.000 | 0.000 | 0.866 | 0.000 | ||
| 16 spectra, QDPSVLHTEEMR | 0.000 | 0.063 | 0.000 | 0.000 | 0.000 | 0.120 | 0.817 | 0.000 | ||
| 1 spectrum, LLGHWEEAAR | 0.000 | 0.000 | 0.000 | 0.000 | 0.000 | 0.000 | 0.987 | 0.013 | ||
| 6 spectra, VMNLISK | 0.000 | 0.037 | 0.000 | 0.000 | 0.000 | 0.005 | 0.958 | 0.000 | ||
| 7 spectra, DLALACK | 0.022 | 0.023 | 0.000 | 0.000 | 0.000 | 0.000 | 0.955 | 0.000 | ||
| 3 spectra, AIDLFTDAIK | 0.000 | 0.000 | 0.000 | 0.000 | 0.000 | 0.000 | 0.975 | 0.025 | ||
| 9 spectra, LDYDEDASAMLR | 0.000 | 0.000 | 0.000 | 0.000 | 0.000 | 0.000 | 1.000 | 0.000 |
| Plot | Mito | Lyso or Perox | ER | Golgi | PM | Cytosol | Nucleus | ||||||
| Expt B |
5 peptides |
12 spectra |
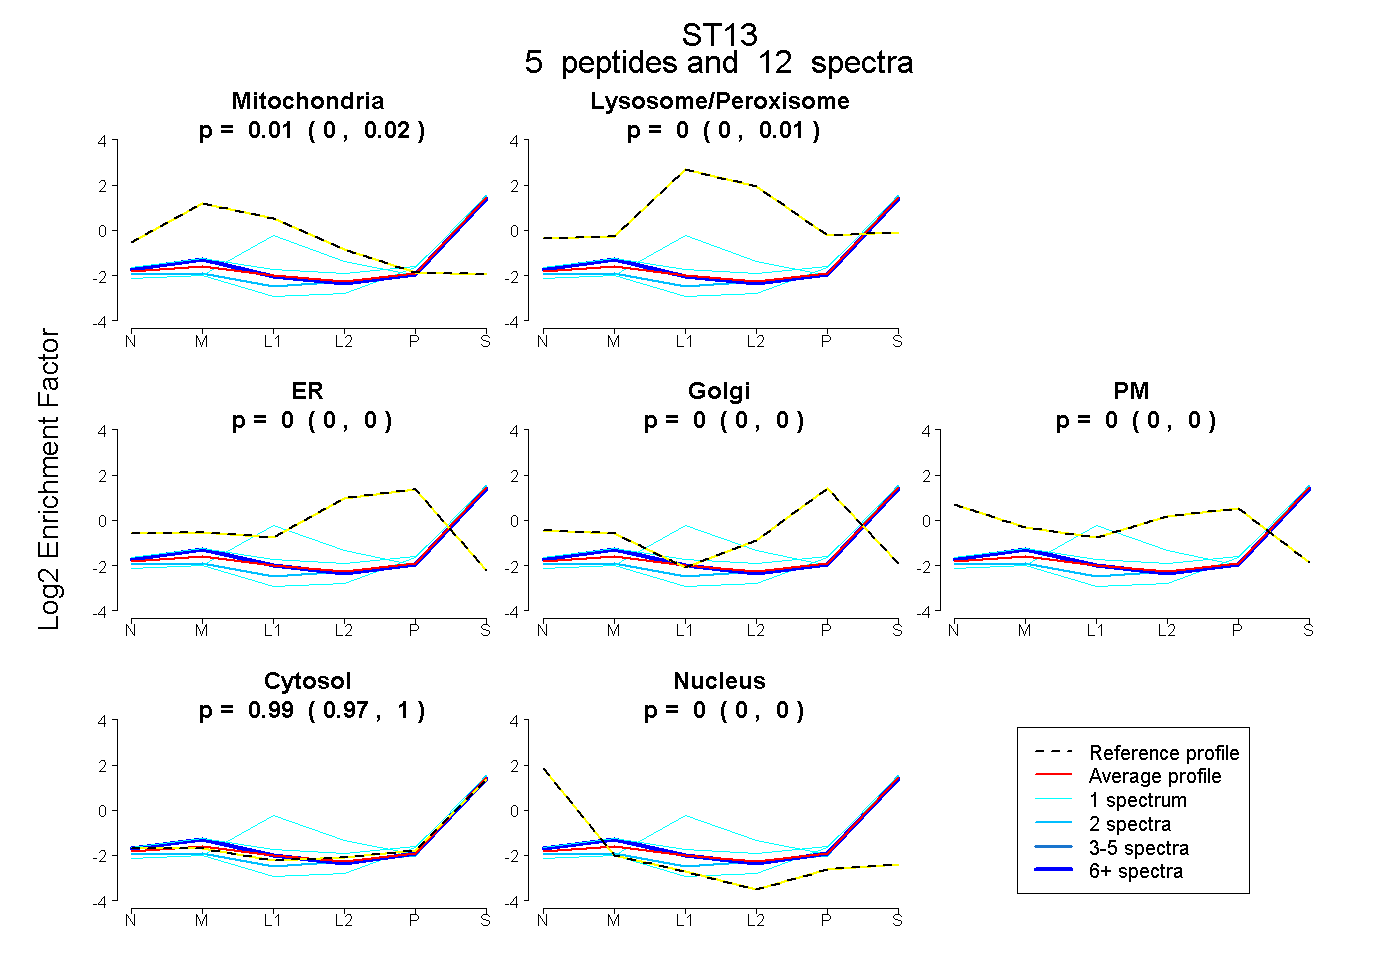 |
0.009 0.000 | 0.022 |
0.000 0.000 | 0.011 |
0.000 0.000 | 0.000 |
0.000 0.000 | 0.000 |
0.000 0.000 | 0.000 |
0.991 0.972 | 1.000 |
0.000 0.000 | 0.000 |
|||
| Plot | Lyso | Other | |||||||||||
| Expt C |
12 peptides |
66 spectra |
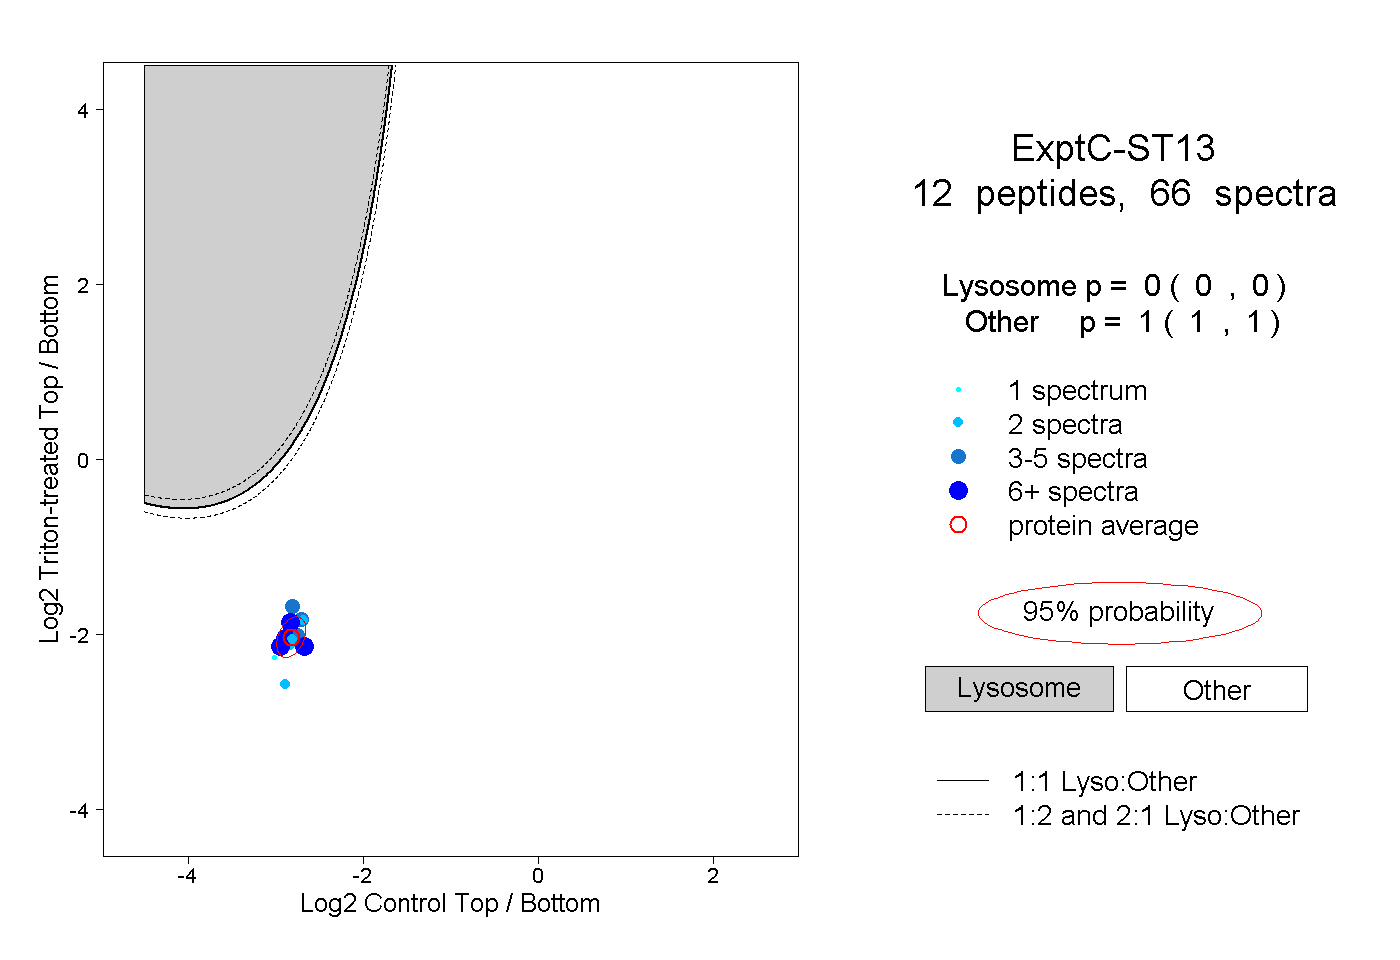 |
0.000 0.000 | 0.000 |
1.000 1.000 | 1.000 |
||||||||
| Plot | Lyso | Other | |||||||||||
| Expt D |
2 peptides |
4 spectra |
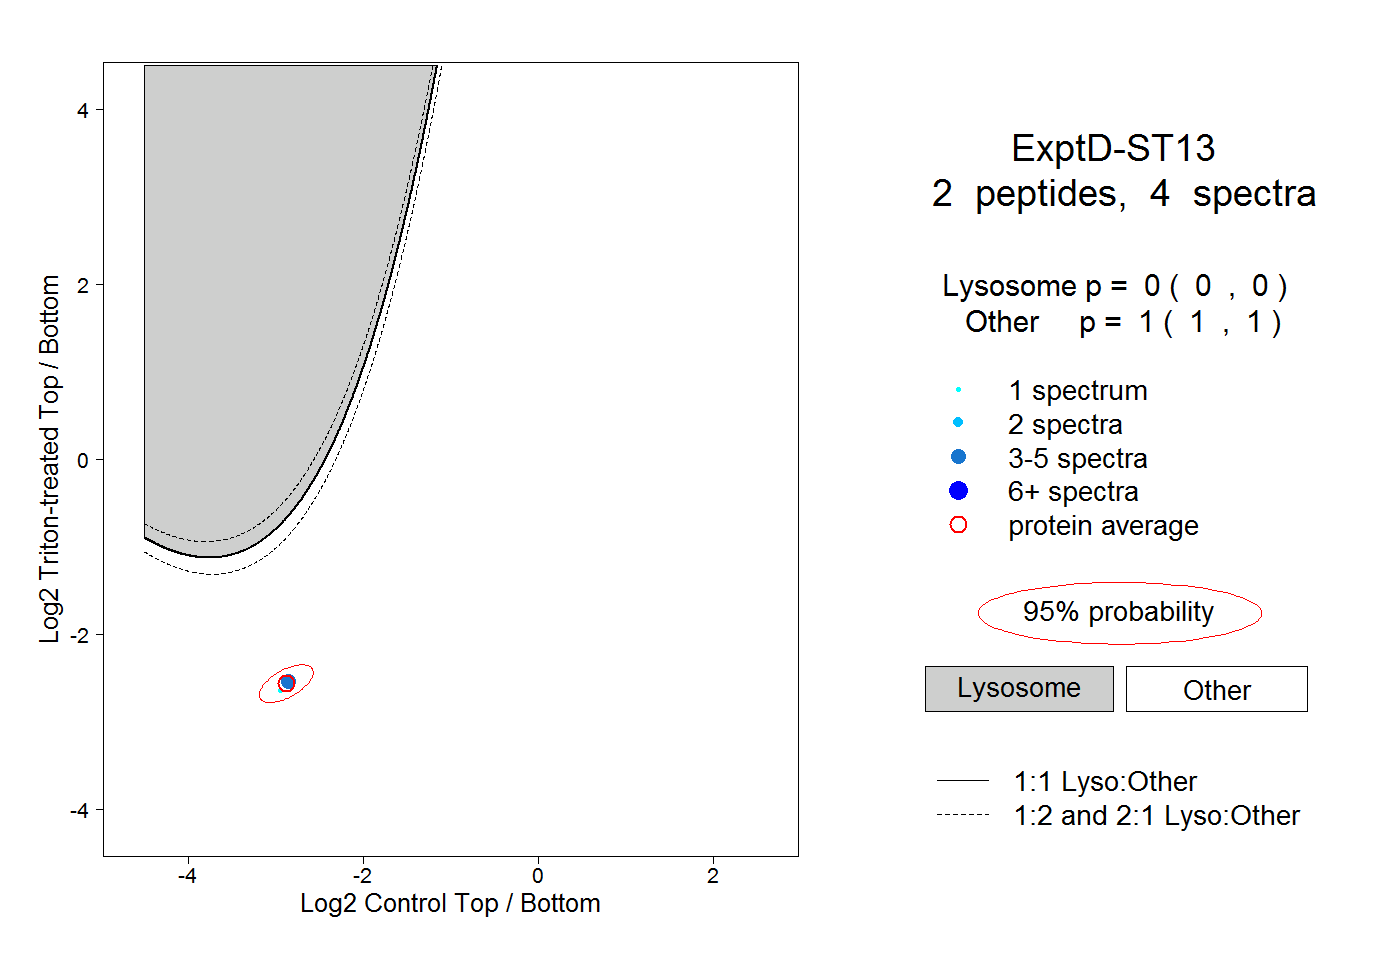 |
0.000 0.000 | 0.000 |
1.000 1.000 | 1.000 |