 5
5peptides
spectra
0.000 | 0.087
0.000 | 0.000
0.000 | 0.080
0.019 | 0.195
0.000 | 0.068
0.000 | 0.116
0.706 | 0.783
0.000 | 0.038
1peptide
spectra
NA | NA
NA | NA
| Plot | Mito | Lyso | Perox | ER | Golgi | PM | Cytosol | Nucleus | |||||
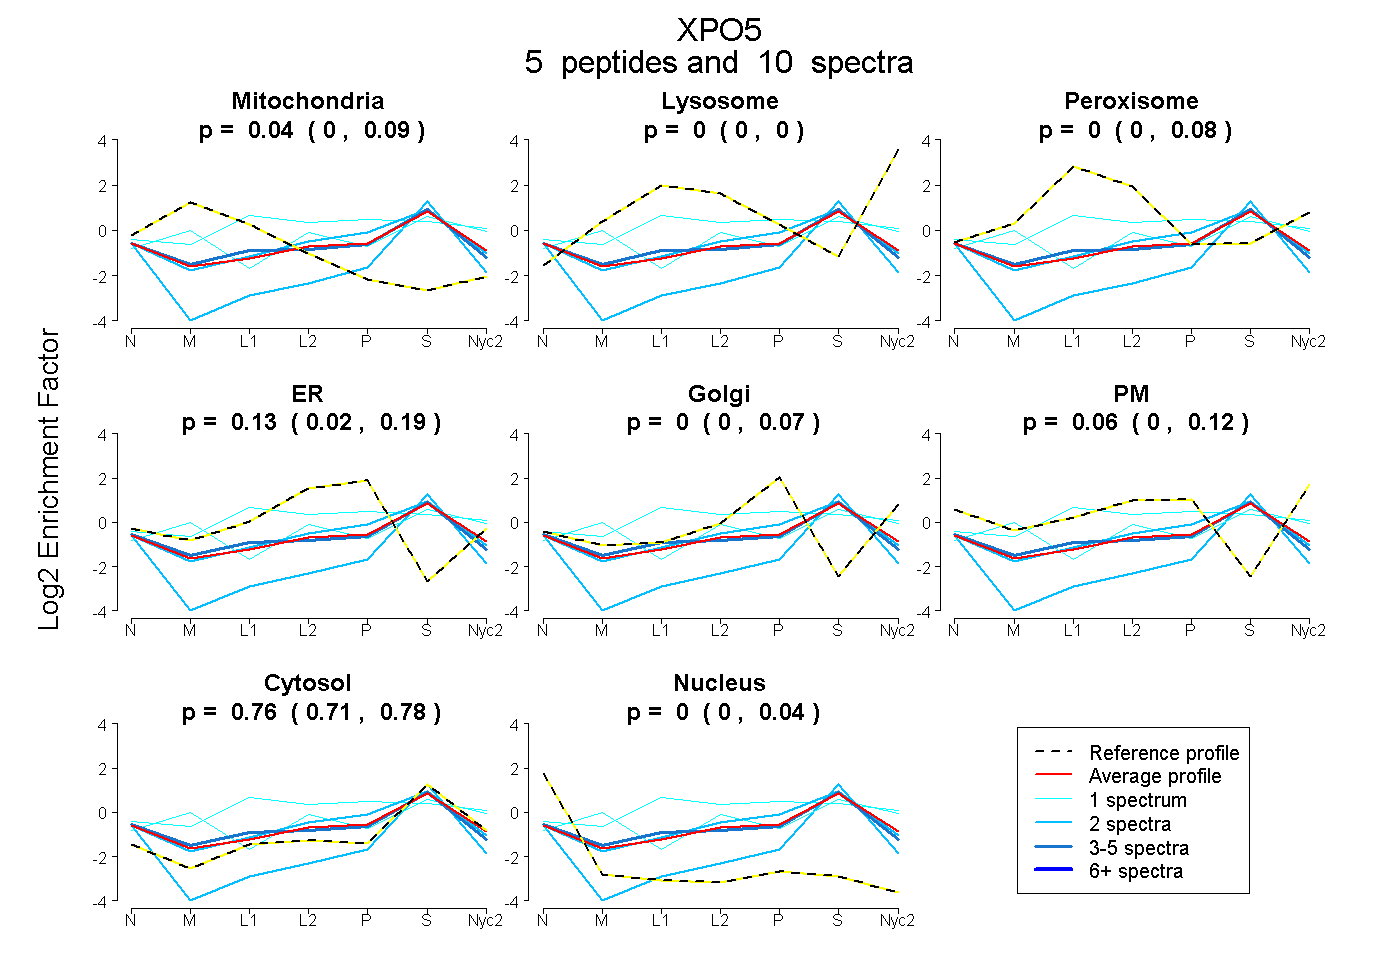
| Expt A |
5 peptides |
10 spectra |
|
0.040 0.000 | 0.087 |
0.000 0.000 | 0.000 |
0.000 0.000 | 0.080 |
0.132 0.019 | 0.195 |
0.000 0.000 | 0.068 |
0.063 0.000 | 0.116 |
0.765 0.706 | 0.783 |
0.000 0.000 | 0.038 |
||
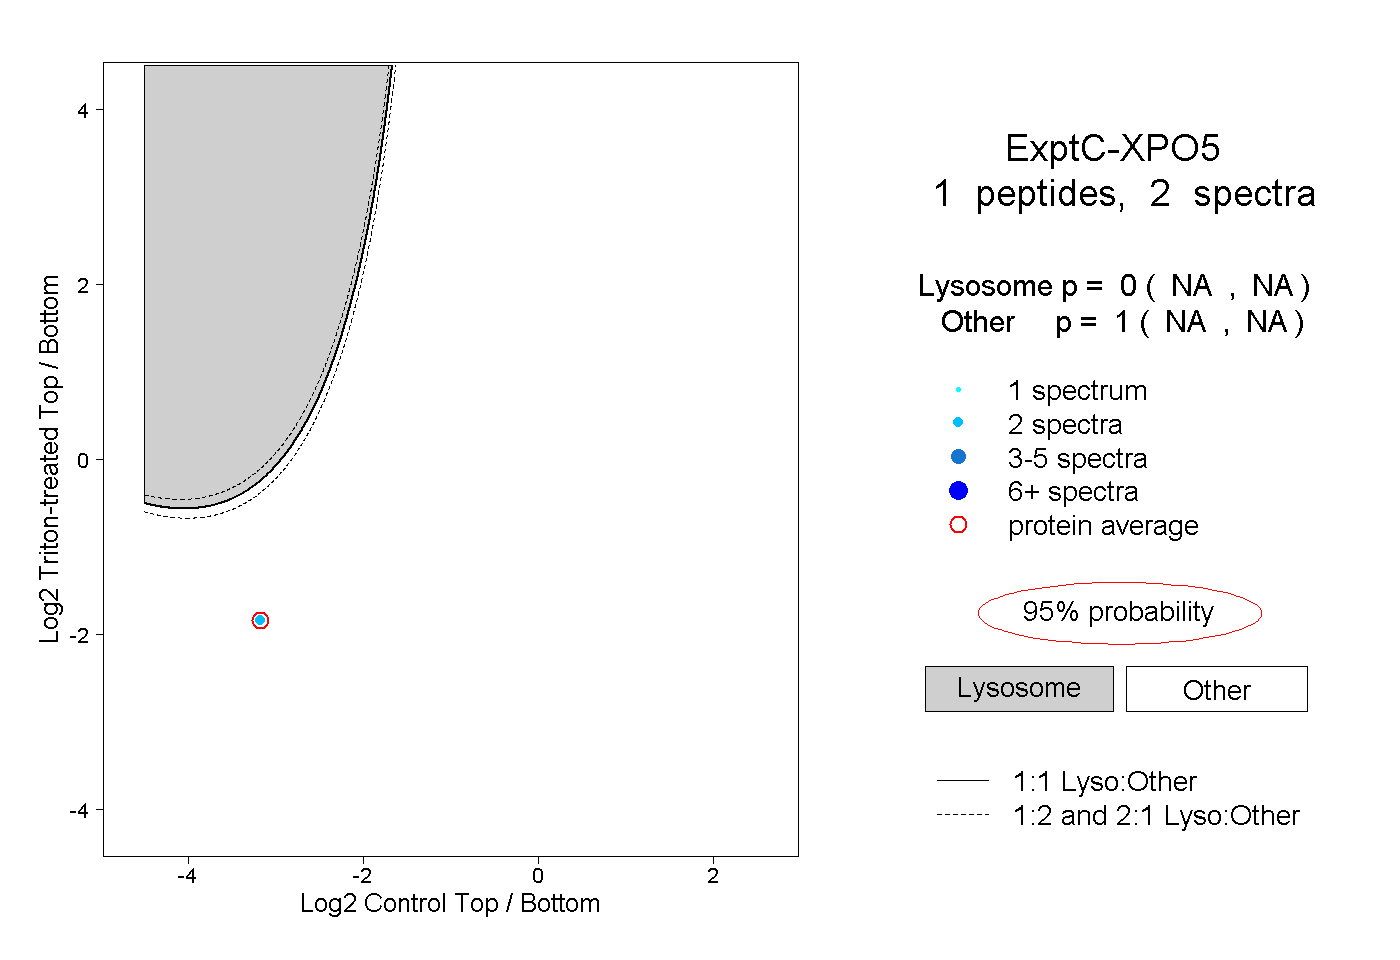
| Plot | Lyso | Other | |||||||||||
| Expt C |
1 peptide |
2 spectra |
|
0.000 NA | NA |
1.000 NA | NA |