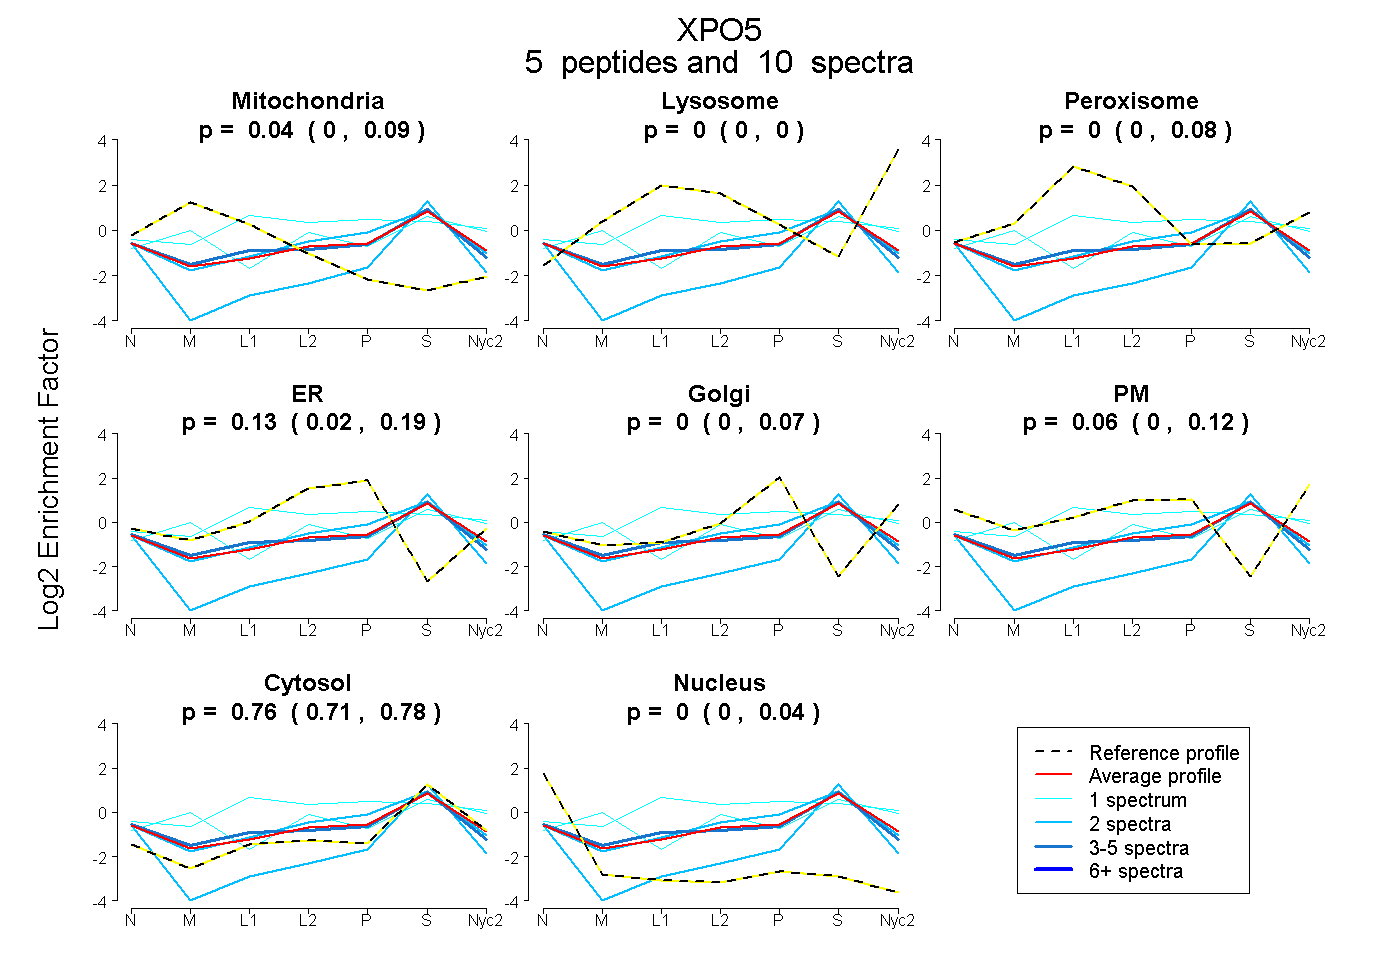
 5
5peptides
spectra
0.000 | 0.087
0.000 | 0.000
0.000 | 0.080
0.019 | 0.195
0.000 | 0.068
0.000 | 0.116
0.706 | 0.783
0.000 | 0.038
| Plot | Mito | Lyso | Perox | ER | Golgi | PM | Cytosol | Nucleus | |||||
| Expt A |
5 peptides |
10 spectra |
|
0.040 0.000 | 0.087 |
0.000 0.000 | 0.000 |
0.000 0.000 | 0.080 |
0.132 0.019 | 0.195 |
0.000 0.000 | 0.068 |
0.063 0.000 | 0.116 |
0.765 0.706 | 0.783 |
0.000 0.000 | 0.038 |
| 2 spectra, DTLSCQR | 0.000 | 0.000 | 0.000 | 0.255 | 0.000 | 0.000 | 0.745 | 0.000 | ||
| 1 spectrum, ASMTNLVK | 0.000 | 0.000 | 0.447 | 0.000 | 0.234 | 0.000 | 0.320 | 0.000 | ||
| 2 spectra, ALDIVESEK | 0.000 | 0.000 | 0.000 | 0.000 | 0.000 | 0.000 | 0.755 | 0.245 | ||
| 4 spectra, ESLDQFDCK | 0.082 | 0.000 | 0.058 | 0.113 | 0.000 | 0.000 | 0.736 | 0.011 | ||
| 1 spectrum, AQHGEVVR | 0.149 | 0.113 | 0.000 | 0.000 | 0.000 | 0.157 | 0.581 | 0.000 |
| Plot | Lyso | Other | |||||||||||
| Expt C |
1 peptide |
2 spectra |
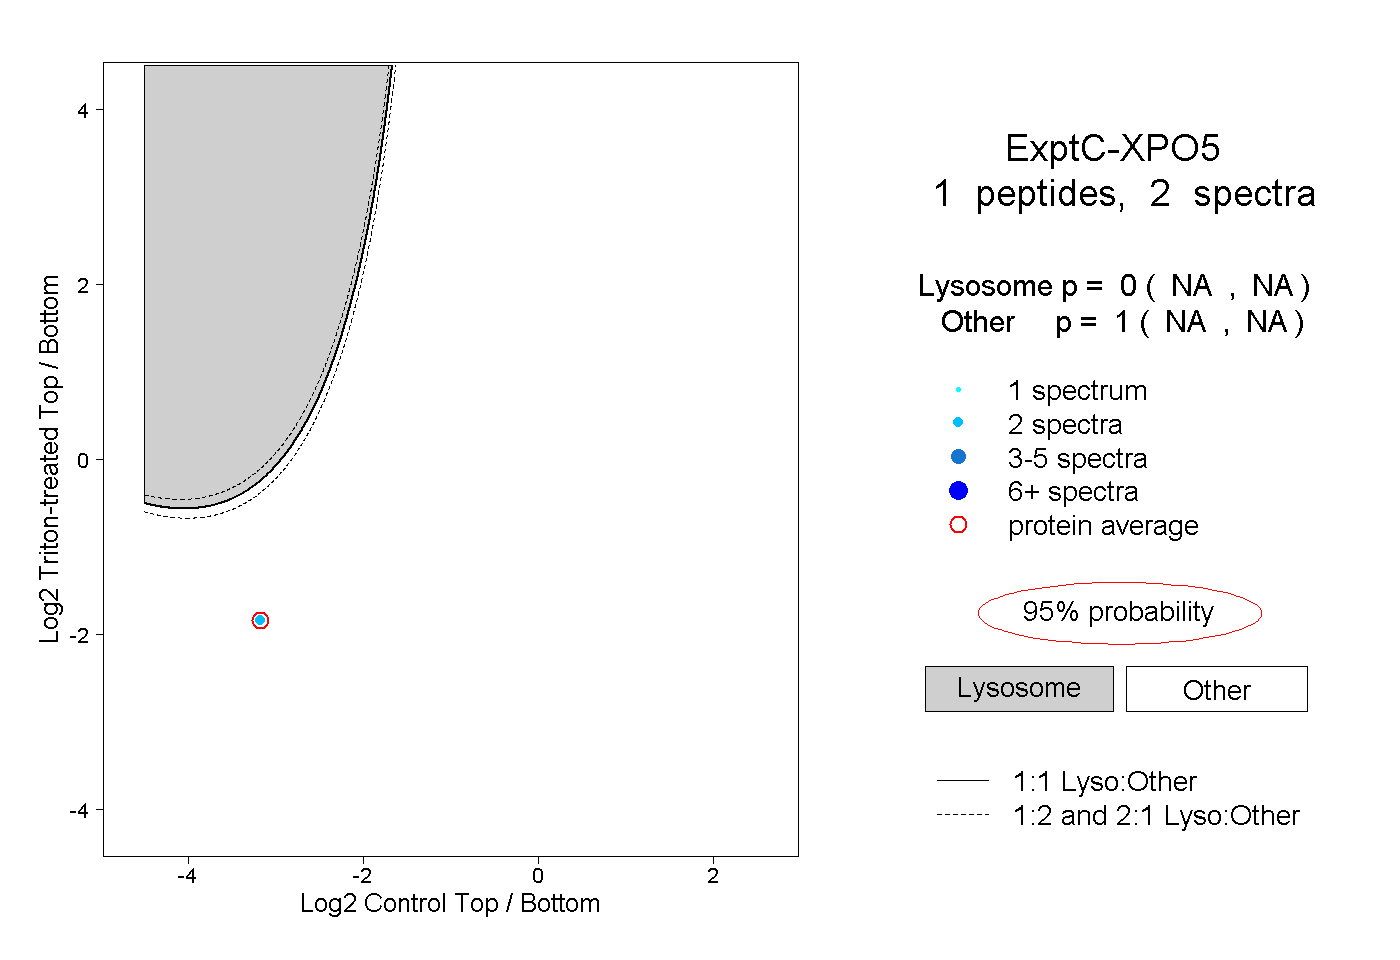 |
0.000 NA | NA |
1.000 NA | NA |