 4
4peptides
spectra
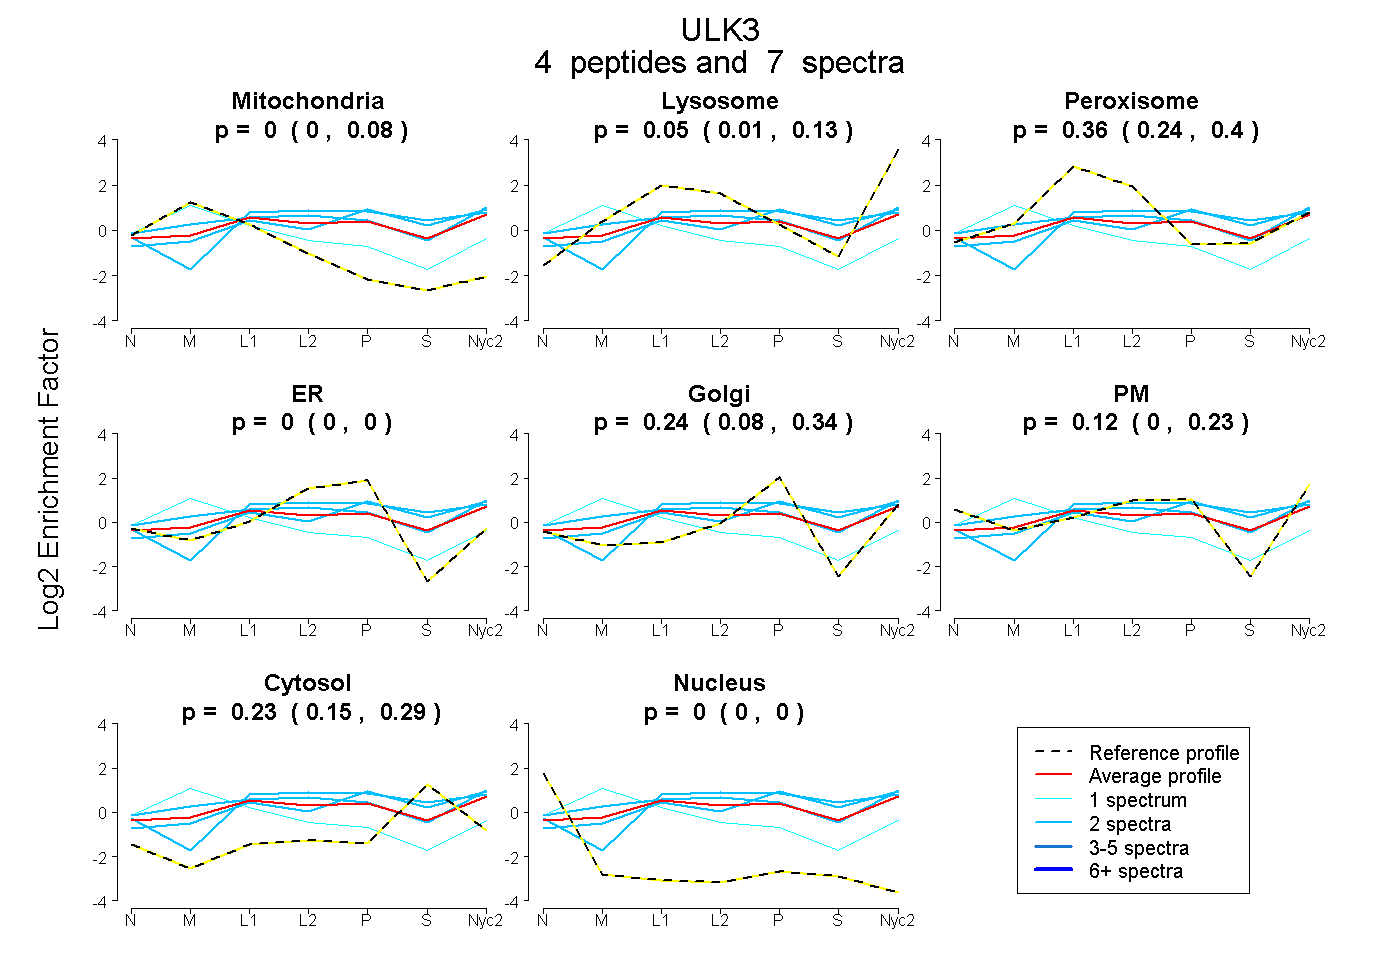
0.000 | 0.079
0.008 | 0.134
0.243 | 0.399
0.000 | 0.000
0.084 | 0.341
0.000 | 0.226
0.150 | 0.287
0.000 | 0.000
1peptide
spectrum
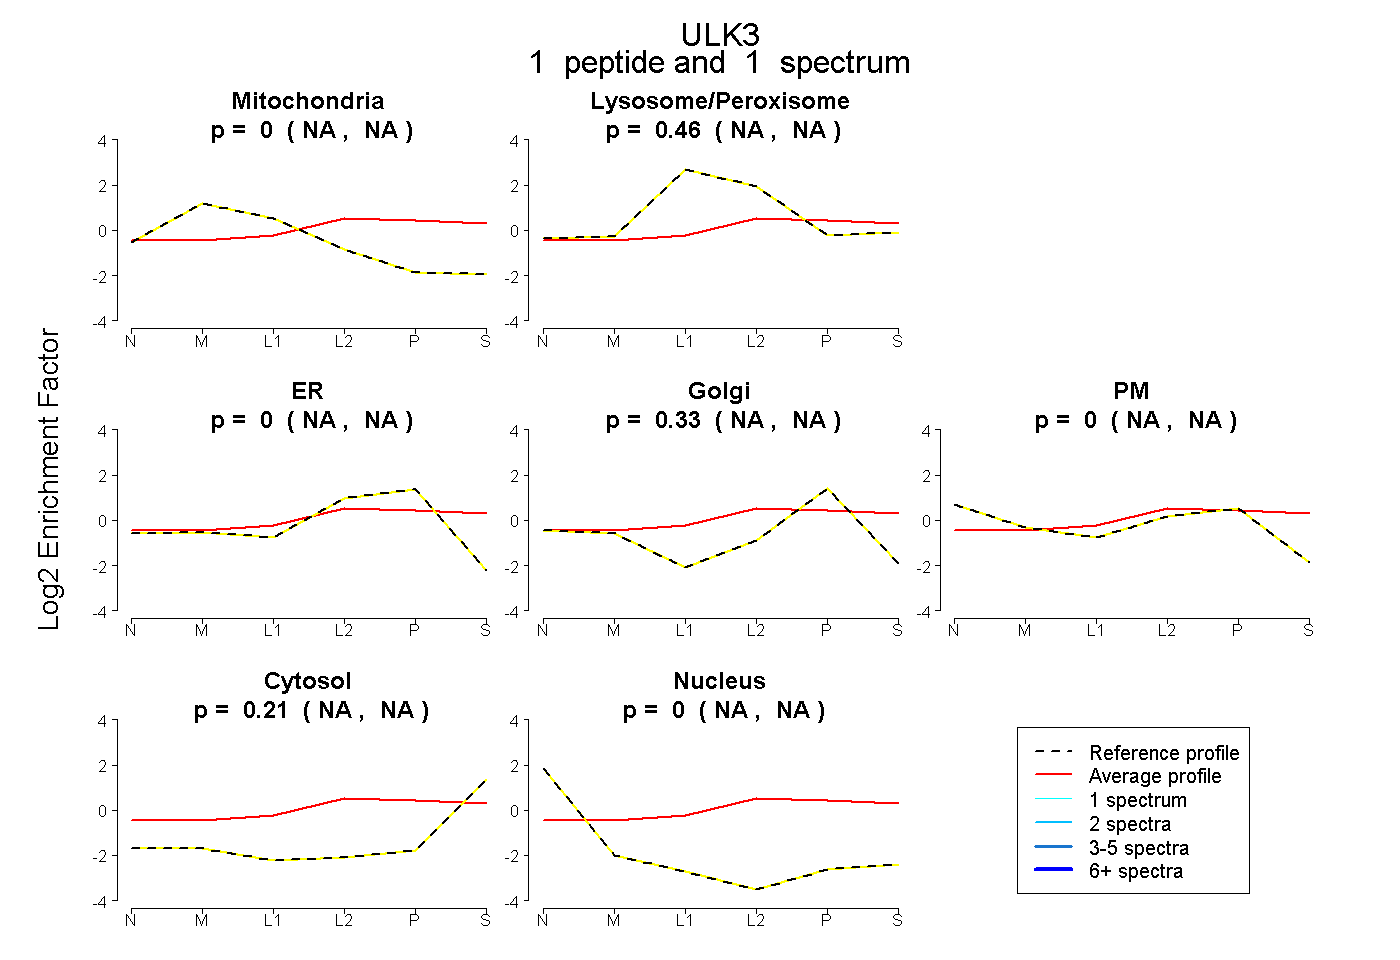
NA | NA
NA | NA
NA | NA
NA | NA
NA | NA
NA | NA
NA | NA
9peptides
spectra
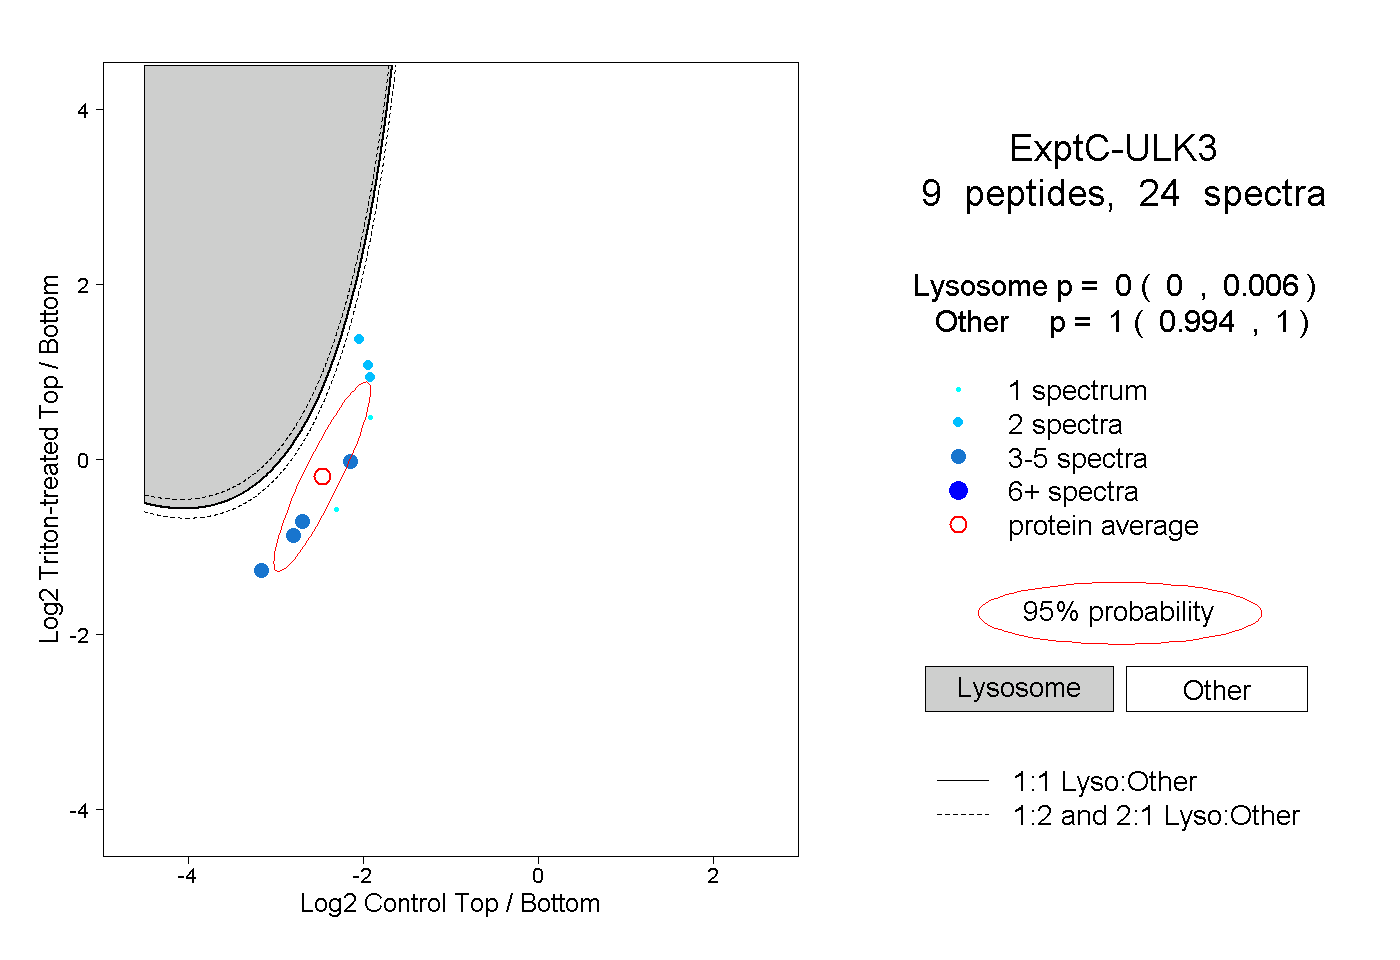
0.000 | 0.006
0.994 | 1.000
2peptides
spectra
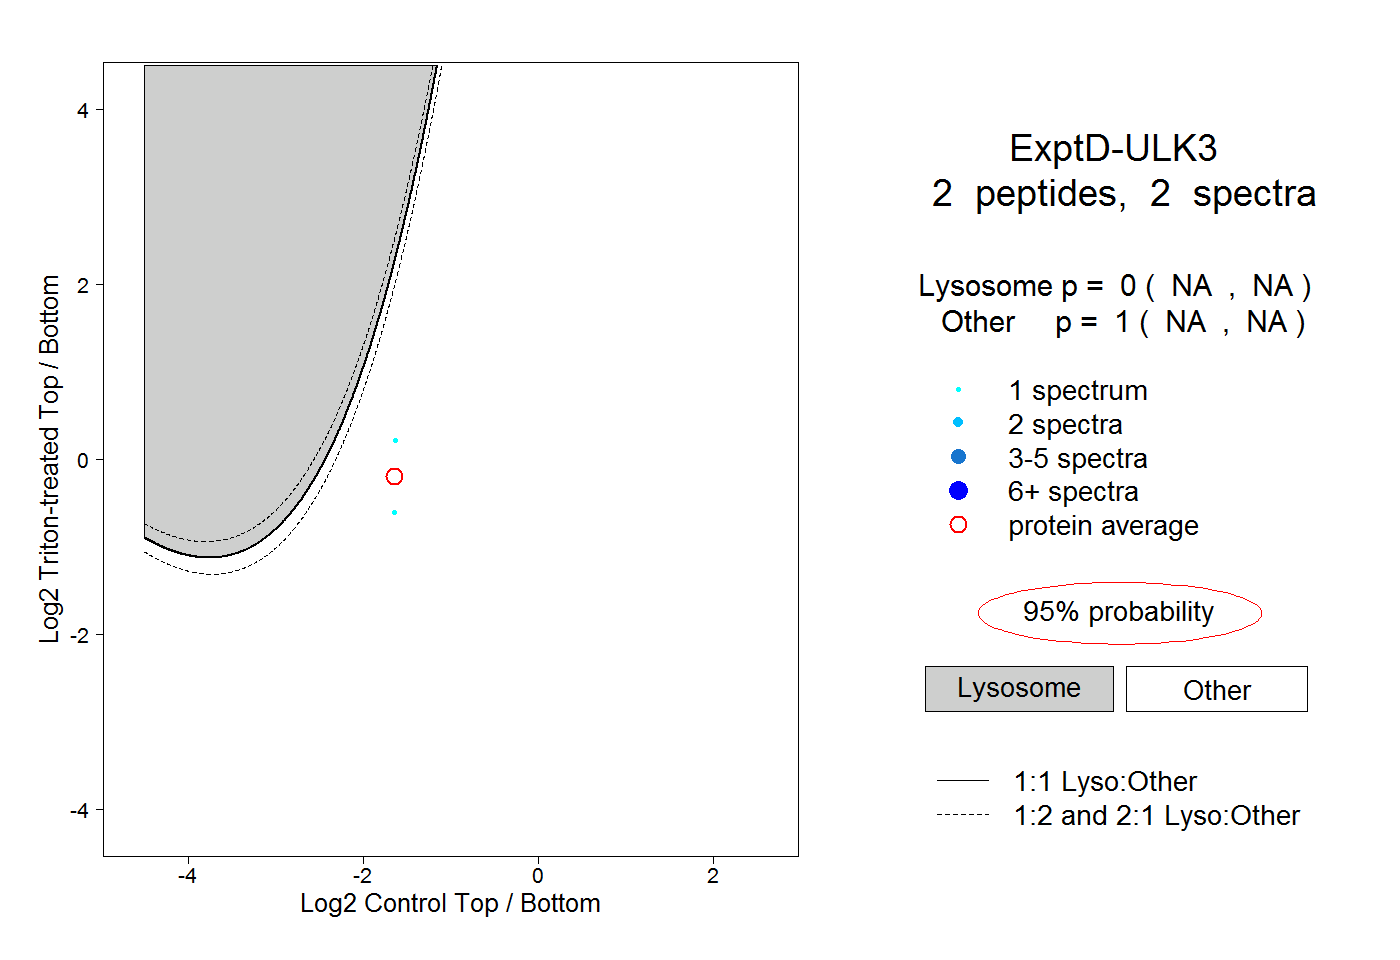
NA | NA
NA | NA