 4
4peptides
spectra
0.000 | 0.079
0.008 | 0.134
0.243 | 0.399
0.000 | 0.000
0.084 | 0.341
0.000 | 0.226
0.150 | 0.287
0.000 | 0.000
| Plot | Mito | Lyso | Perox | ER | Golgi | PM | Cytosol | Nucleus | |||||
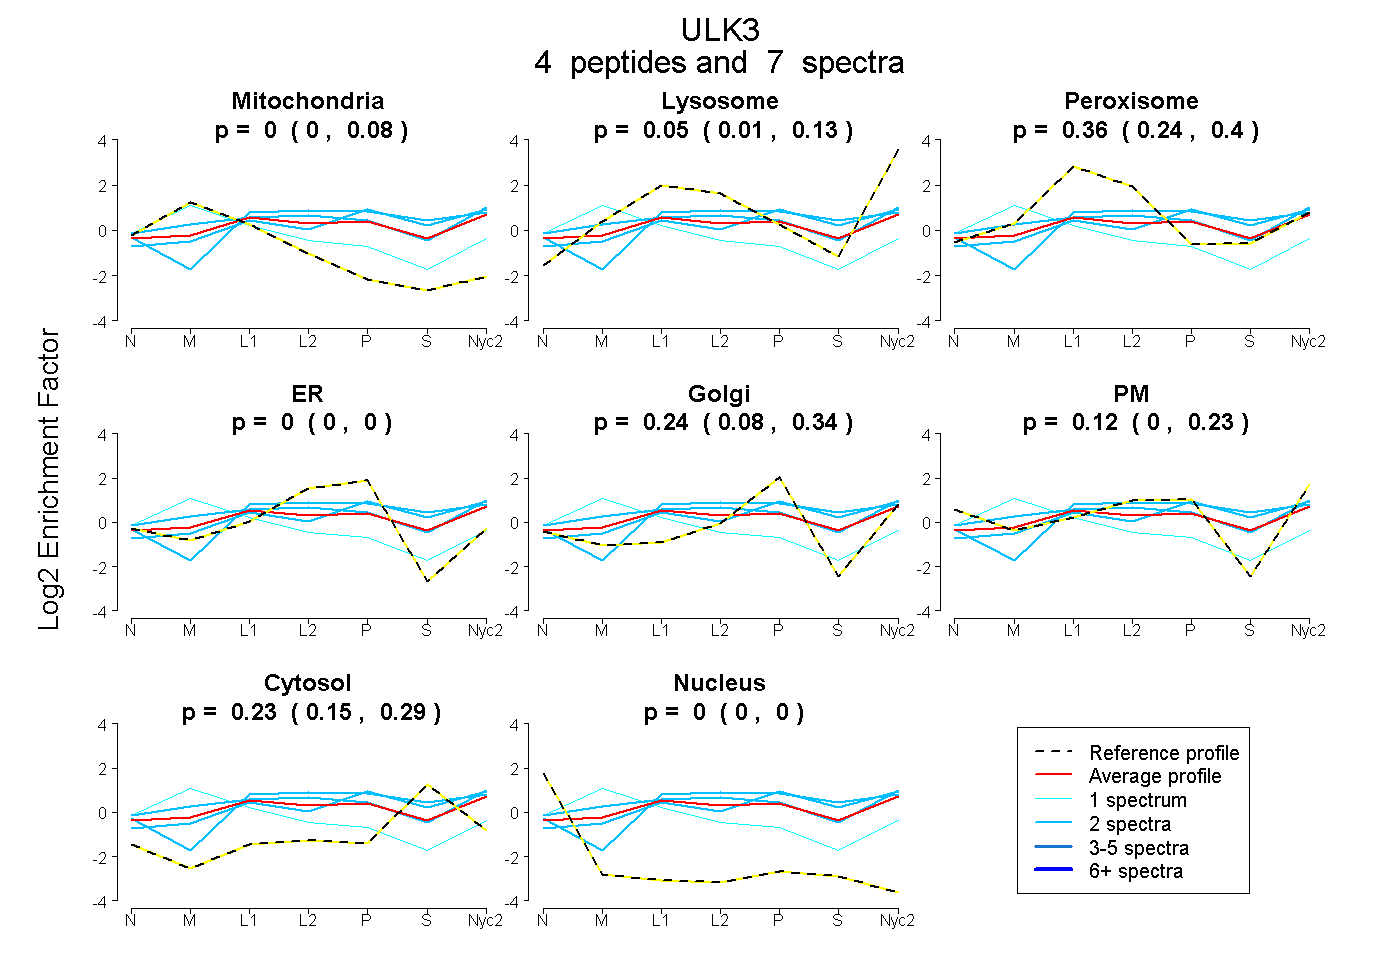
| Expt A |
4 peptides |
7 spectra |
|
0.001 0.000 | 0.079 |
0.055 0.008 | 0.134 |
0.357 0.243 | 0.399 |
0.000 0.000 | 0.000 |
0.239 0.084 | 0.341 |
0.119 0.000 | 0.226 |
0.229 0.150 | 0.287 |
0.000 0.000 | 0.000 |
| 2 spectra, AIVSSSNQALLR | 0.000 | 0.216 | 0.197 | 0.000 | 0.292 | 0.000 | 0.294 | 0.000 | ||
| 2 spectra, VIELPLRPQLSLDCR | 0.000 | 0.157 | 0.234 | 0.193 | 0.017 | 0.054 | 0.345 | 0.000 | ||
| 1 spectrum, ELLHTEVQNLMAR | 0.581 | 0.149 | 0.000 | 0.000 | 0.083 | 0.142 | 0.045 | 0.000 | ||
| 2 spectra, HPHIVQLK | 0.014 | 0.095 | 0.325 | 0.000 | 0.106 | 0.286 | 0.173 | 0.000 |
| Plot | Mito | Lyso or Perox | ER | Golgi | PM | Cytosol | Nucleus | ||||||
| Expt B |
1 peptide |
1 spectrum |
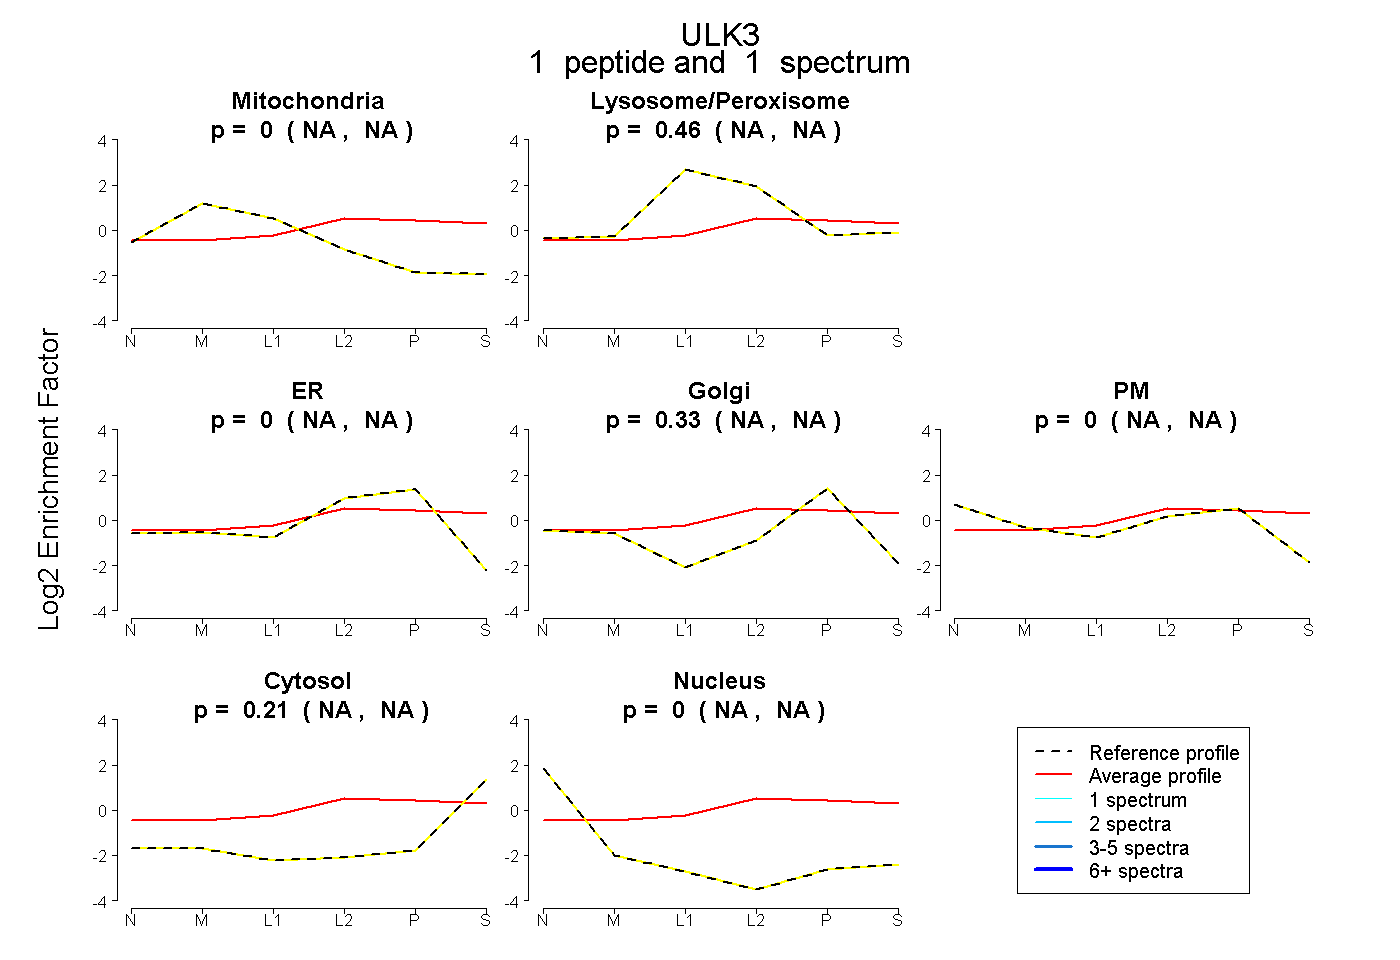 |
0.000 NA | NA |
0.463 NA | NA |
0.000 NA | NA |
0.330 NA | NA |
0.000 NA | NA |
0.207 NA | NA |
0.000 NA | NA |
|||
| Plot | Lyso | Other | |||||||||||
| Expt C |
9 peptides |
24 spectra |
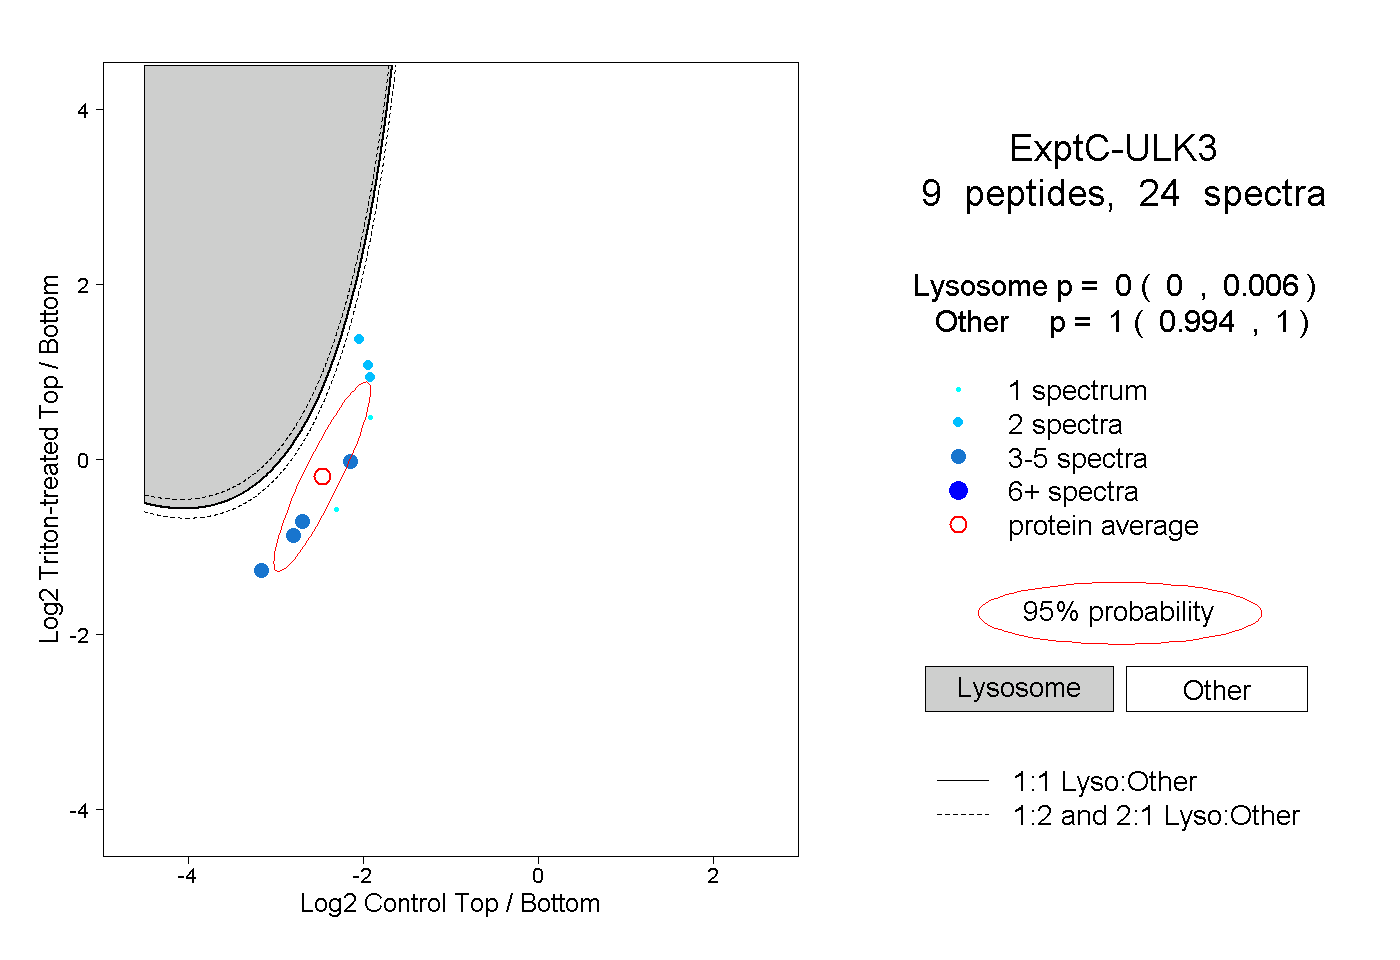 |
0.000 0.000 | 0.006 |
1.000 0.994 | 1.000 |
||||||||
| Plot | Lyso | Other | |||||||||||
| Expt D |
2 peptides |
2 spectra |
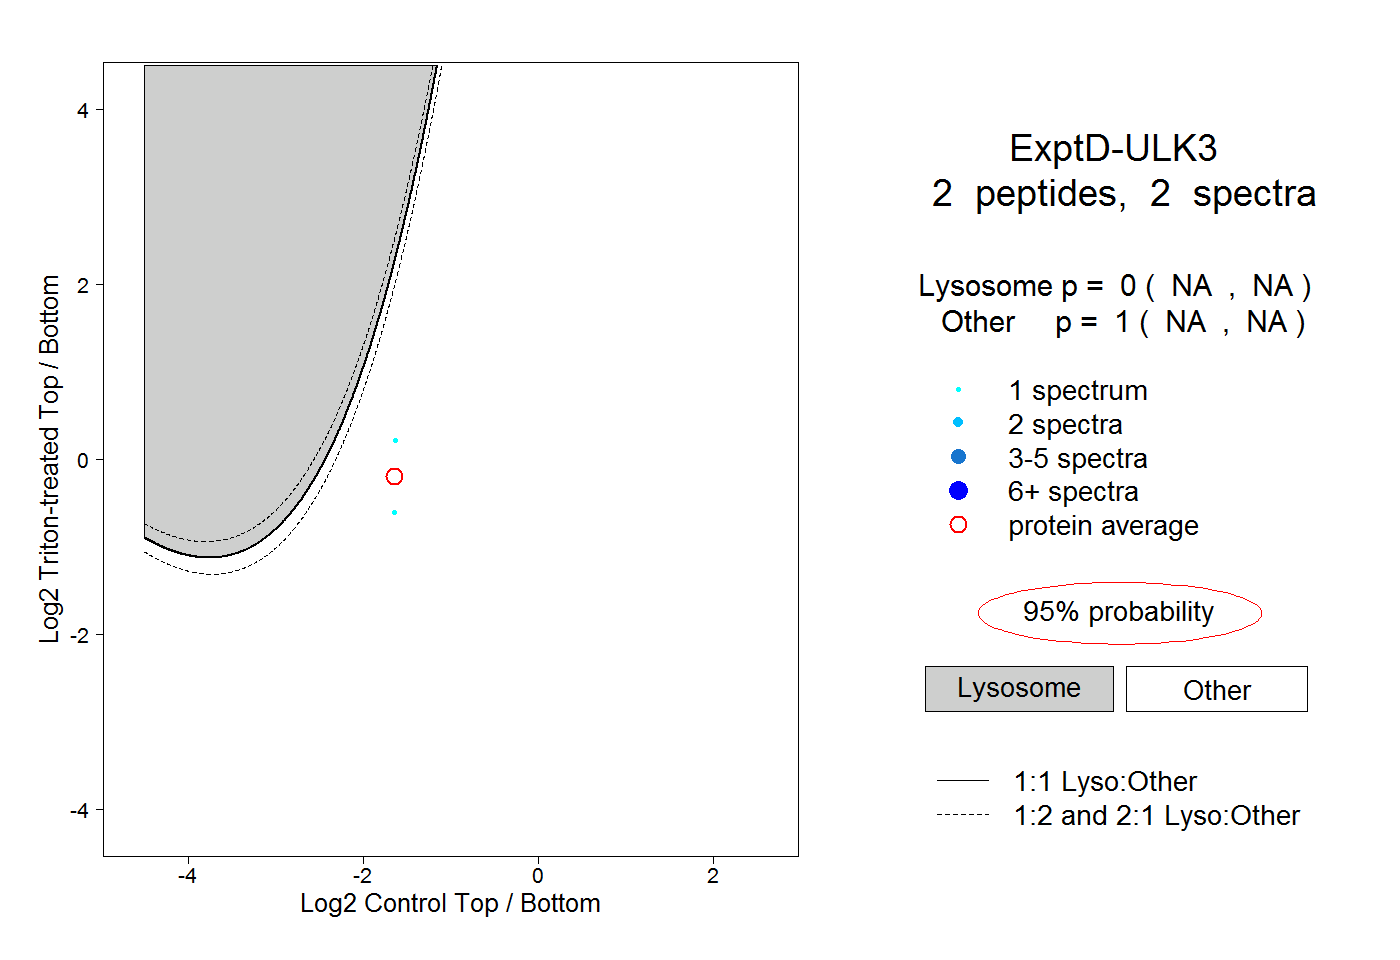 |
0.000 NA | NA |
1.000 NA | NA |