 17
17peptides
spectra
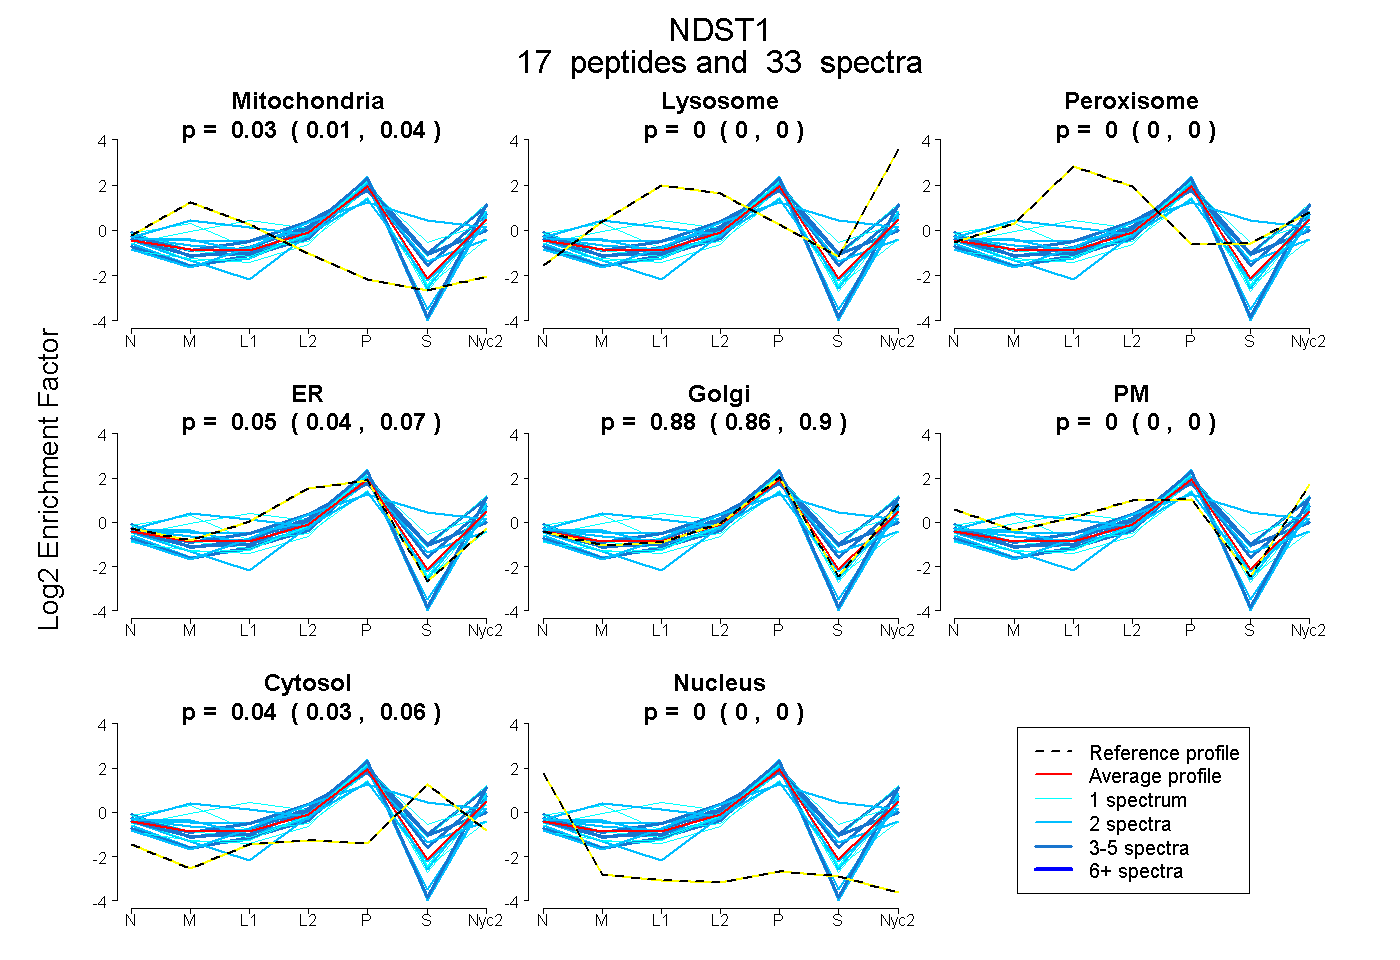
0.014 | 0.037
0.000 | 0.000
0.000 | 0.003
0.035 | 0.067
0.857 | 0.897
0.000 | 0.000
0.025 | 0.057
0.000 | 0.000
2peptides
spectra
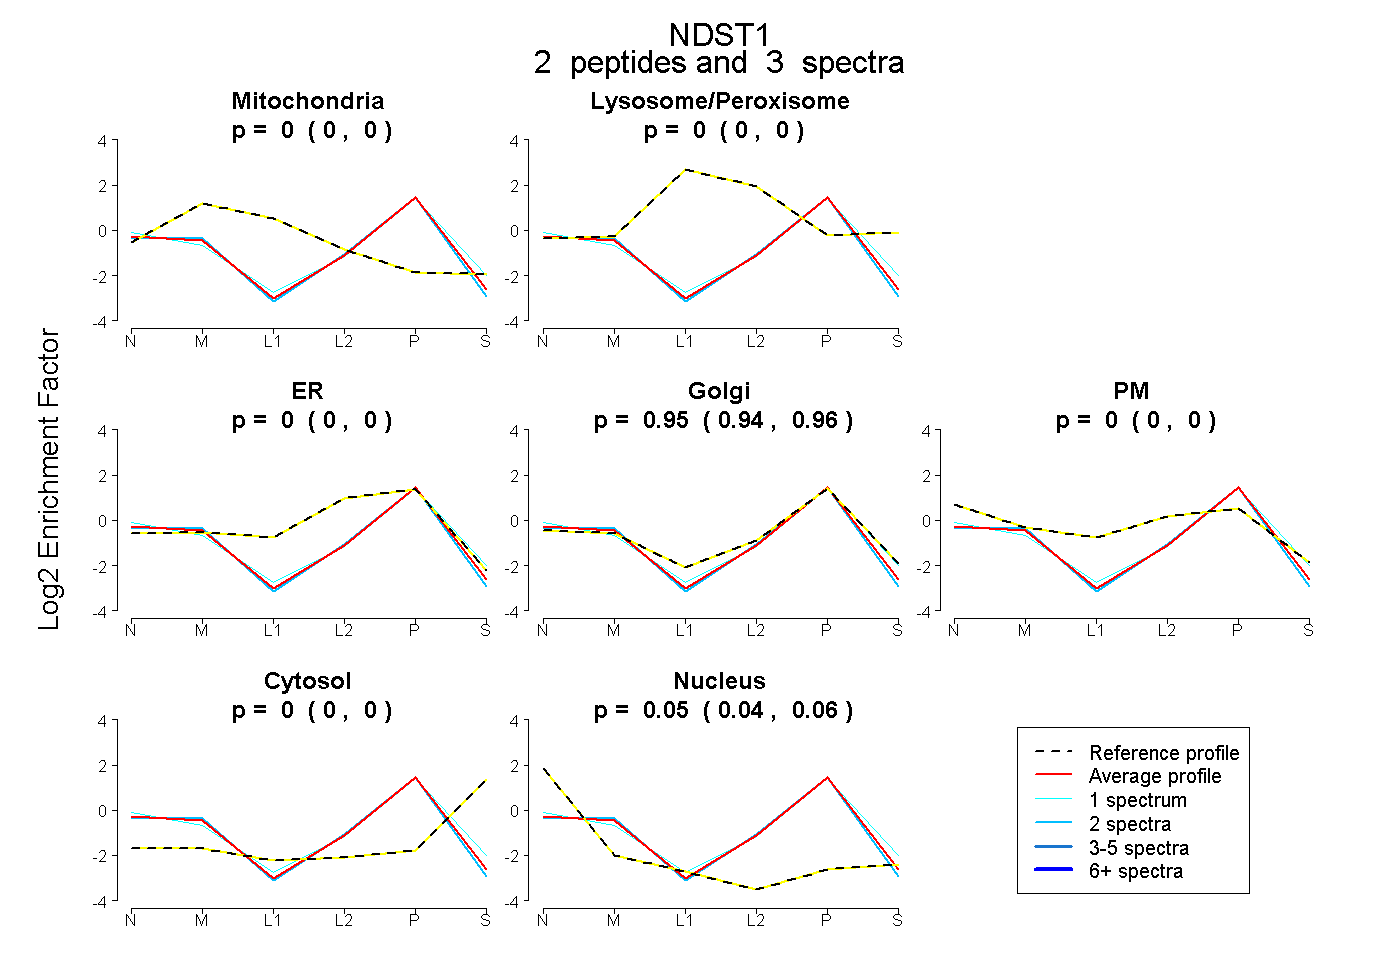
0.000 | 0.000
0.000 | 0.000
0.000 | 0.000
0.939 | 0.959
0.000 | 0.000
0.000 | 0.000
0.039 | 0.059
7peptides
spectra
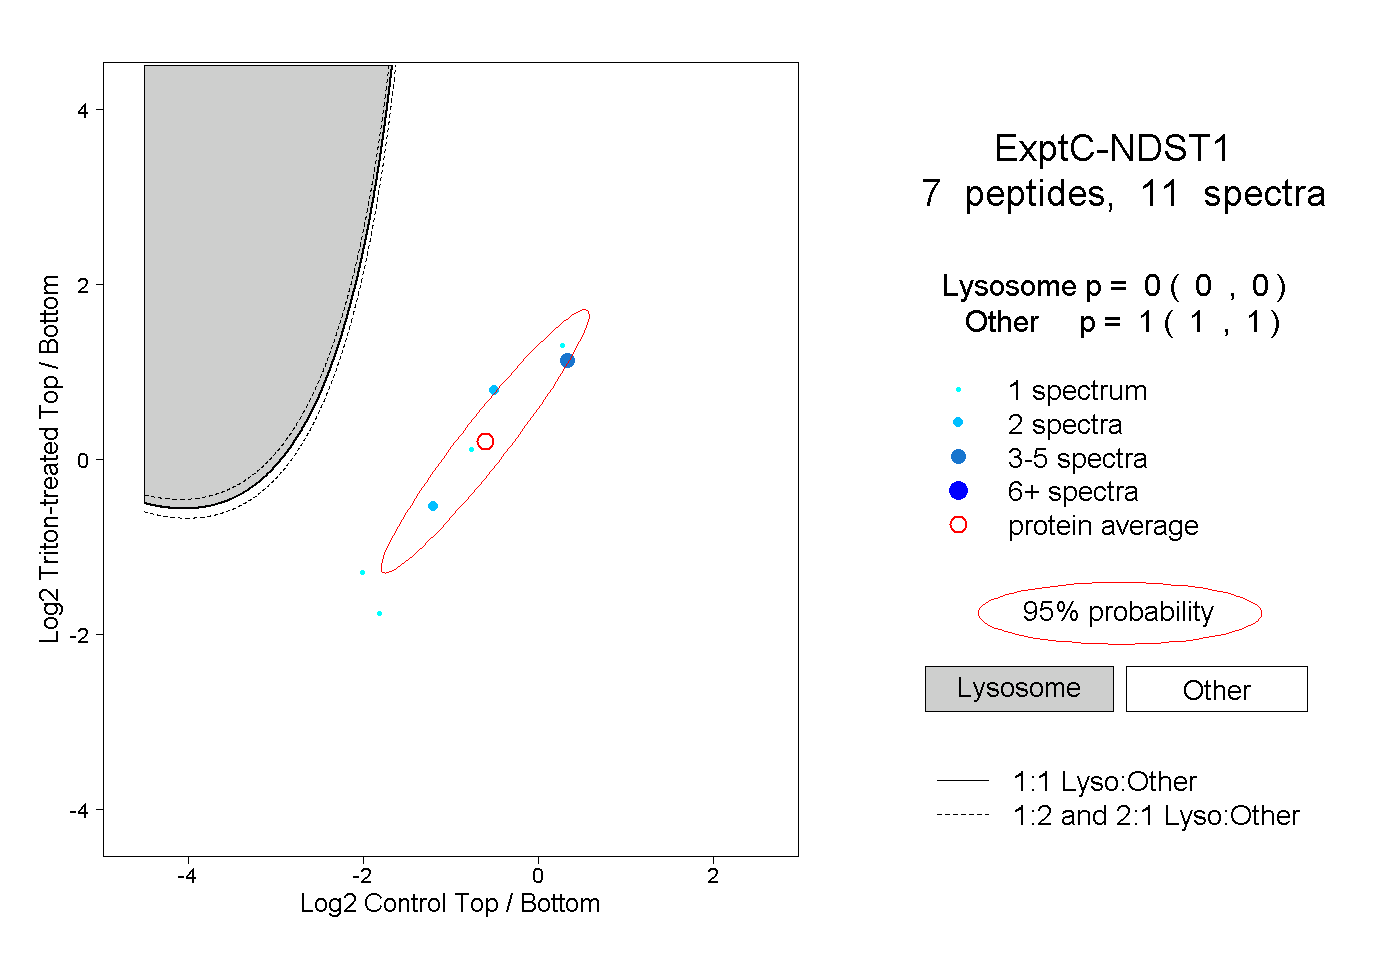
0.000 | 0.000
1.000 | 1.000