 17
17peptides
spectra
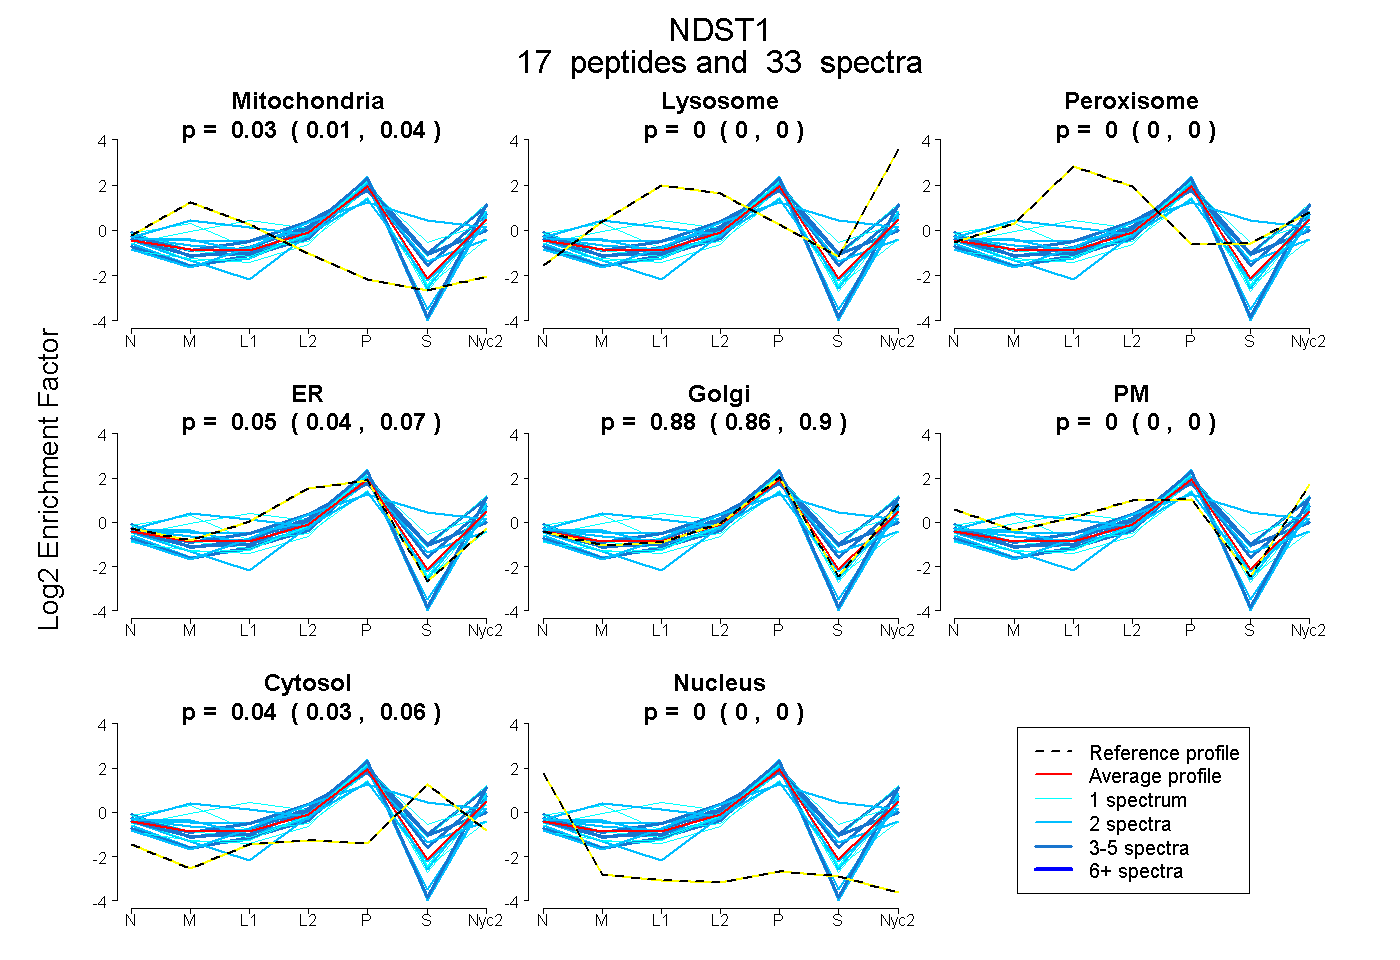
0.014 | 0.037
0.000 | 0.000
0.000 | 0.003
0.035 | 0.067
0.857 | 0.897
0.000 | 0.000
0.025 | 0.057
0.000 | 0.000
| Plot | Mito | Lyso | Perox | ER | Golgi | PM | Cytosol | Nucleus | |||||
| Expt A |
17 peptides |
33 spectra |
|
0.026 0.014 | 0.037 |
0.000 0.000 | 0.000 |
0.000 0.000 | 0.003 |
0.053 0.035 | 0.067 |
0.878 0.857 | 0.897 |
0.000 0.000 | 0.000 |
0.043 0.025 | 0.057 |
0.000 0.000 | 0.000 |
| 2 spectra, MGQTLPTWLR | 0.060 | 0.000 | 0.000 | 0.000 | 0.940 | 0.000 | 0.000 | 0.000 | ||
| 1 spectrum, GFWCQLLEGGK | 0.289 | 0.000 | 0.000 | 0.001 | 0.711 | 0.000 | 0.000 | 0.000 | ||
| 3 spectra, LQTLPPVQLAQK | 0.000 | 0.000 | 0.047 | 0.352 | 0.412 | 0.000 | 0.189 | 0.000 | ||
| 3 spectra, GFIHNGIMVLPR | 0.000 | 0.020 | 0.000 | 0.000 | 0.784 | 0.000 | 0.196 | 0.000 | ||
| 1 spectrum, GFPLFLHSNLGLK | 0.100 | 0.137 | 0.000 | 0.272 | 0.491 | 0.000 | 0.000 | 0.000 | ||
| 2 spectra, LSLPLDR | 0.000 | 0.000 | 0.000 | 0.000 | 0.943 | 0.000 | 0.000 | 0.057 | ||
| 4 spectra, VLTILINPADR | 0.000 | 0.000 | 0.000 | 0.005 | 0.990 | 0.006 | 0.000 | 0.000 | ||
| 1 spectrum, SPLLYVTRPSEVEK | 0.000 | 0.000 | 0.000 | 0.000 | 0.967 | 0.000 | 0.000 | 0.033 | ||
| 2 spectra, YVNLDAWNR | 0.000 | 0.092 | 0.000 | 0.262 | 0.181 | 0.000 | 0.466 | 0.000 | ||
| 2 spectra, ALFDTQNELR | 0.000 | 0.000 | 0.000 | 0.000 | 0.998 | 0.000 | 0.000 | 0.002 | ||
| 2 spectra, CLVPGWYATHIER | 0.048 | 0.000 | 0.000 | 0.253 | 0.526 | 0.000 | 0.173 | 0.000 | ||
| 3 spectra, AHDDPVALK | 0.000 | 0.000 | 0.000 | 0.068 | 0.690 | 0.133 | 0.110 | 0.000 | ||
| 2 spectra, LLPIKPVQAVAPSR | 0.076 | 0.000 | 0.000 | 0.177 | 0.735 | 0.013 | 0.000 | 0.000 | ||
| 1 spectrum, SANYFDSEVAPR | 0.000 | 0.000 | 0.000 | 0.000 | 1.000 | 0.000 | 0.000 | 0.000 | ||
| 2 spectra, VMDTVQK | 0.233 | 0.084 | 0.043 | 0.092 | 0.548 | 0.000 | 0.000 | 0.000 | ||
| 1 spectrum, LGLYTFK | 0.000 | 0.076 | 0.000 | 0.000 | 0.668 | 0.120 | 0.137 | 0.000 | ||
| 1 spectrum, LLIIGPQK | 0.000 | 0.000 | 0.000 | 0.000 | 0.703 | 0.000 | 0.297 | 0.000 |
| Plot | Mito | Lyso or Perox | ER | Golgi | PM | Cytosol | Nucleus | ||||||
| Expt B |
2 peptides |
3 spectra |
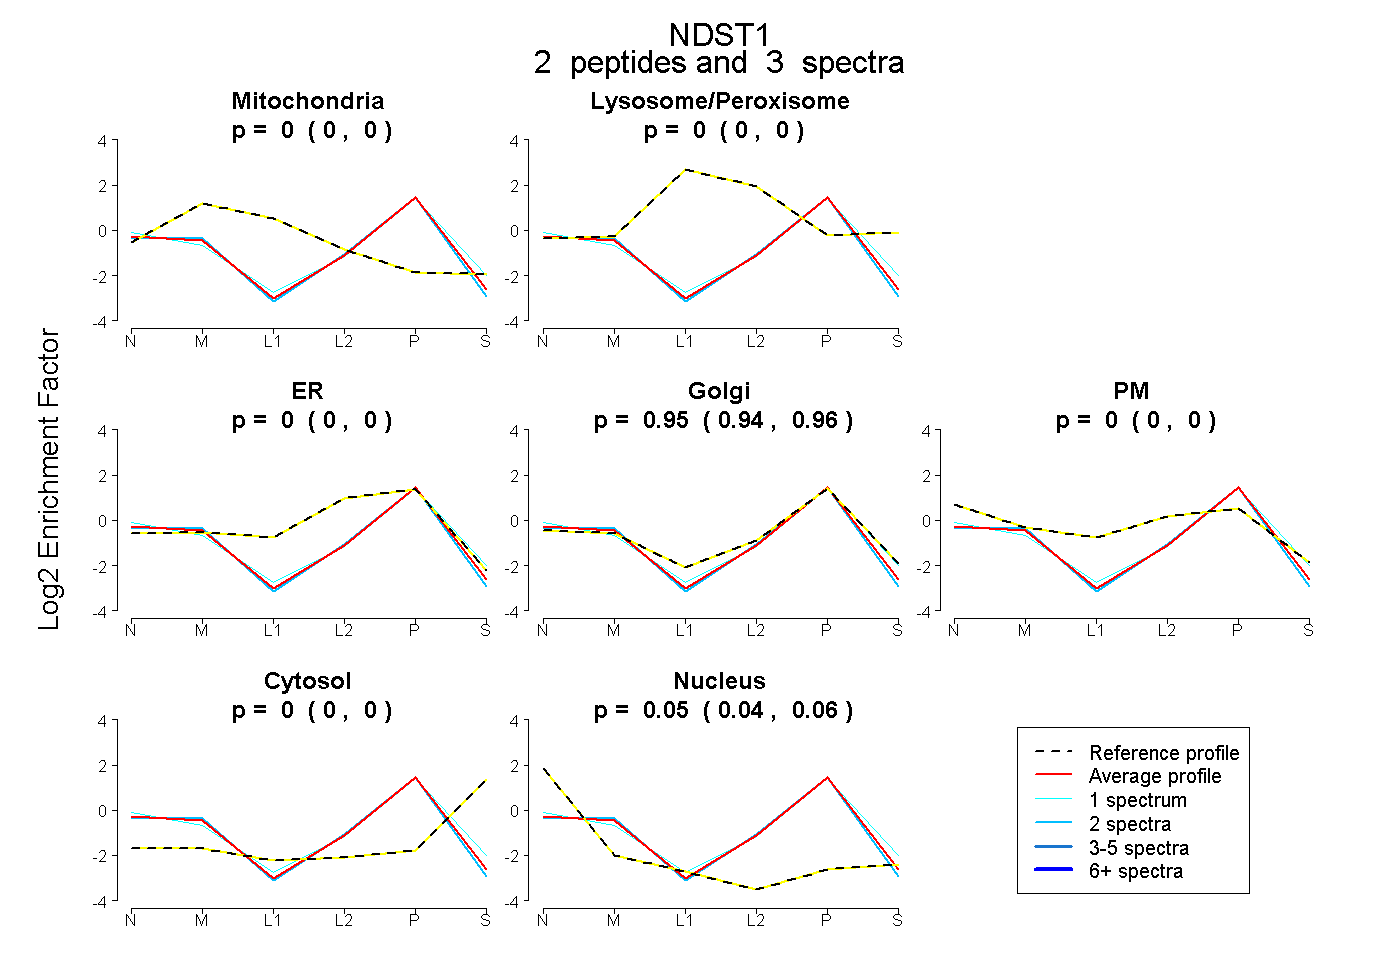 |
0.000 0.000 | 0.000 |
0.000 0.000 | 0.000 |
0.000 0.000 | 0.000 |
0.950 0.939 | 0.959 |
0.000 0.000 | 0.000 |
0.000 0.000 | 0.000 |
0.050 0.039 | 0.059 |
|||
| Plot | Lyso | Other | |||||||||||
| Expt C |
7 peptides |
11 spectra |
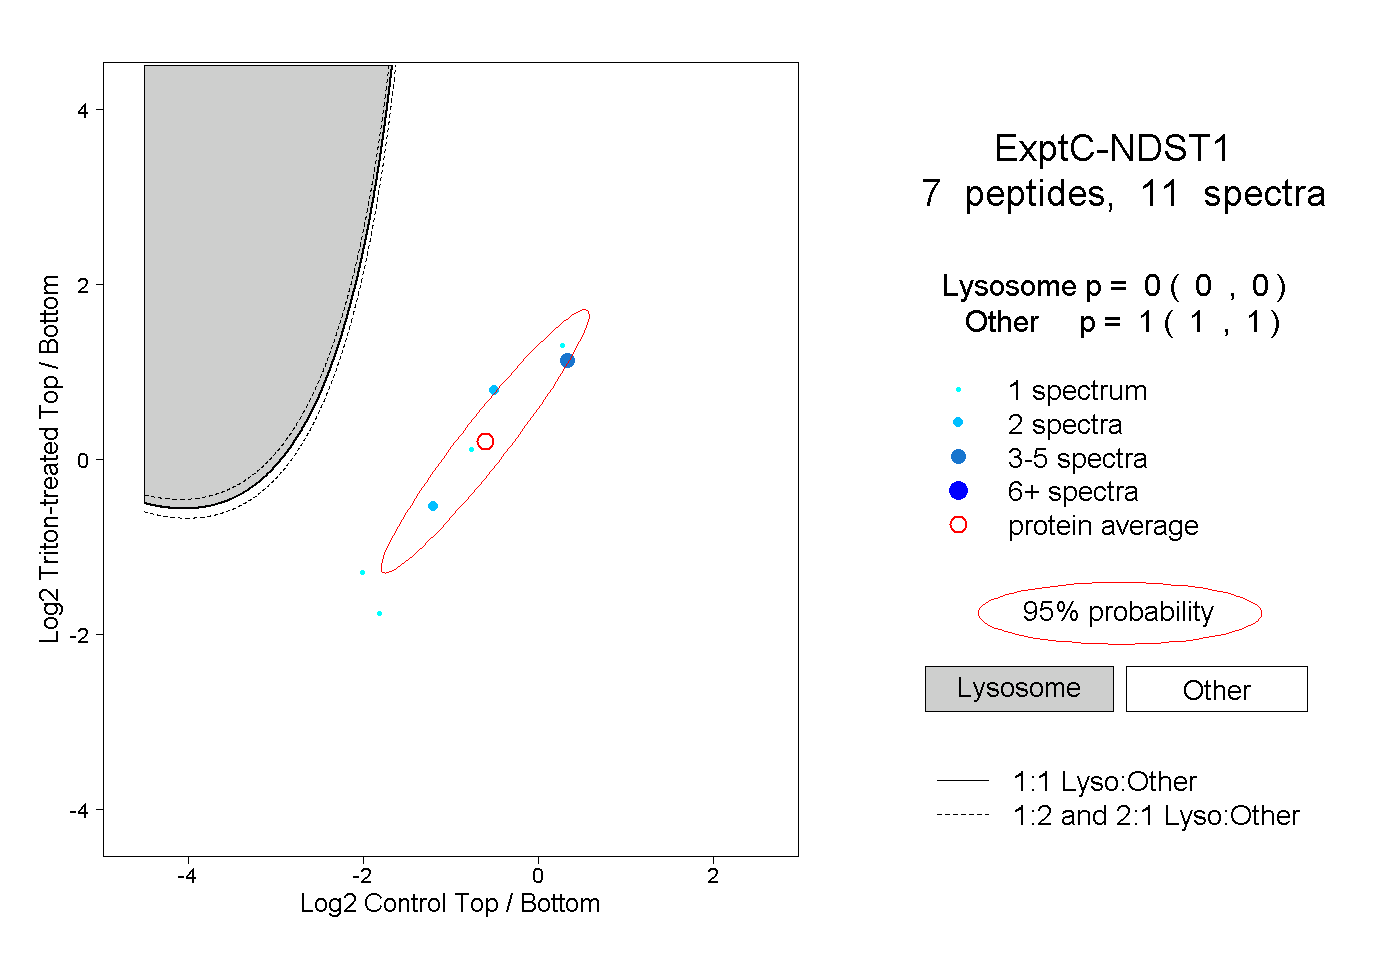 |
0.000 0.000 | 0.000 |
1.000 1.000 | 1.000 |