 5
5peptides
spectra
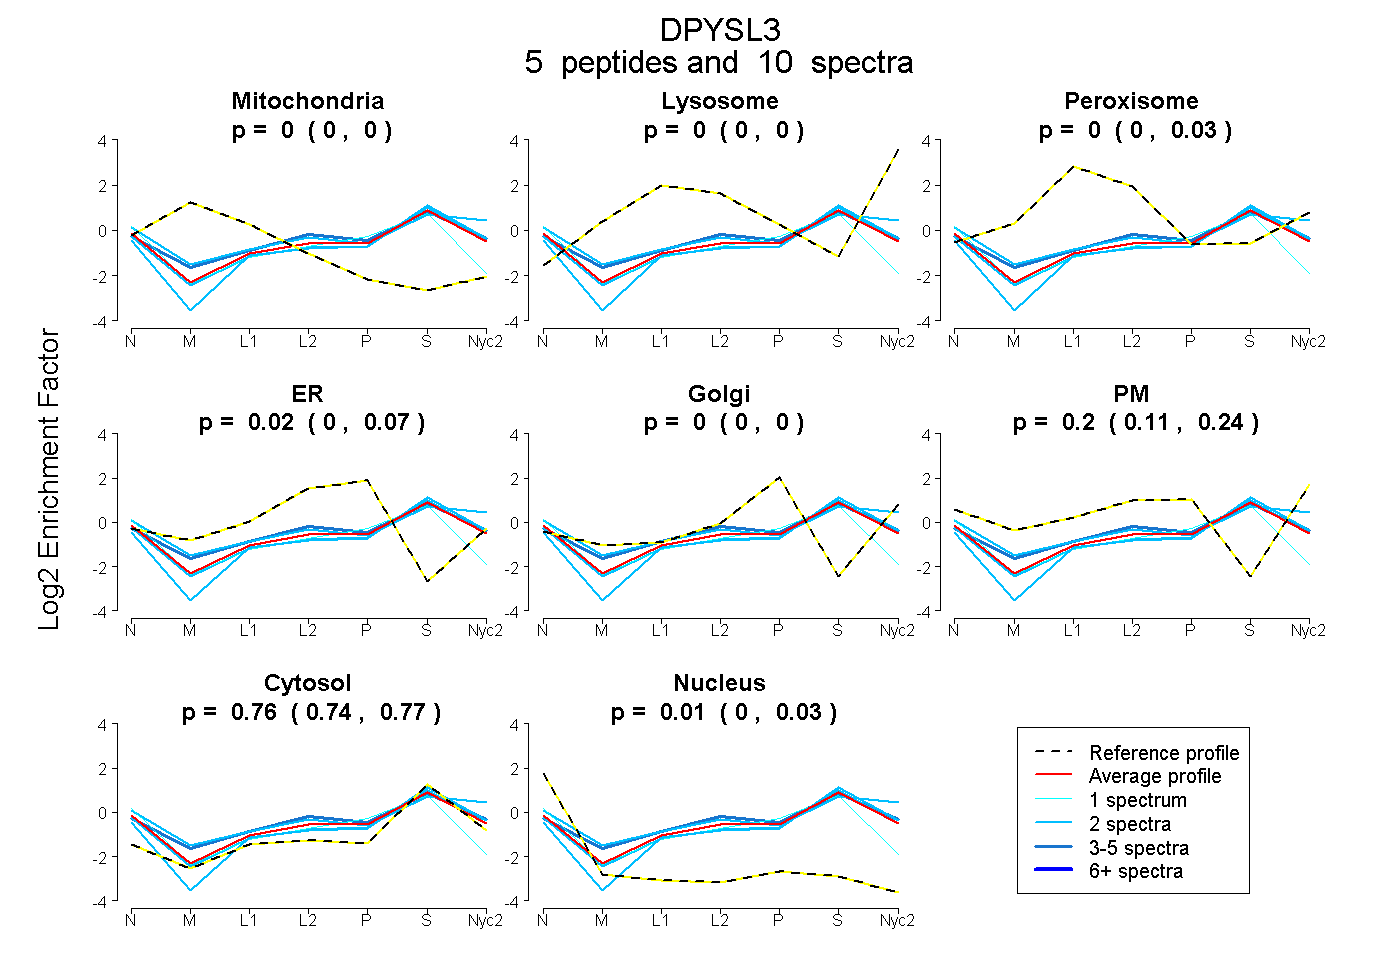
0.000 | 0.000
0.000 | 0.000
0.000 | 0.029
0.000 | 0.075
0.000 | 0.000
0.110 | 0.237
0.737 | 0.774
0.000 | 0.033
2peptides
spectra
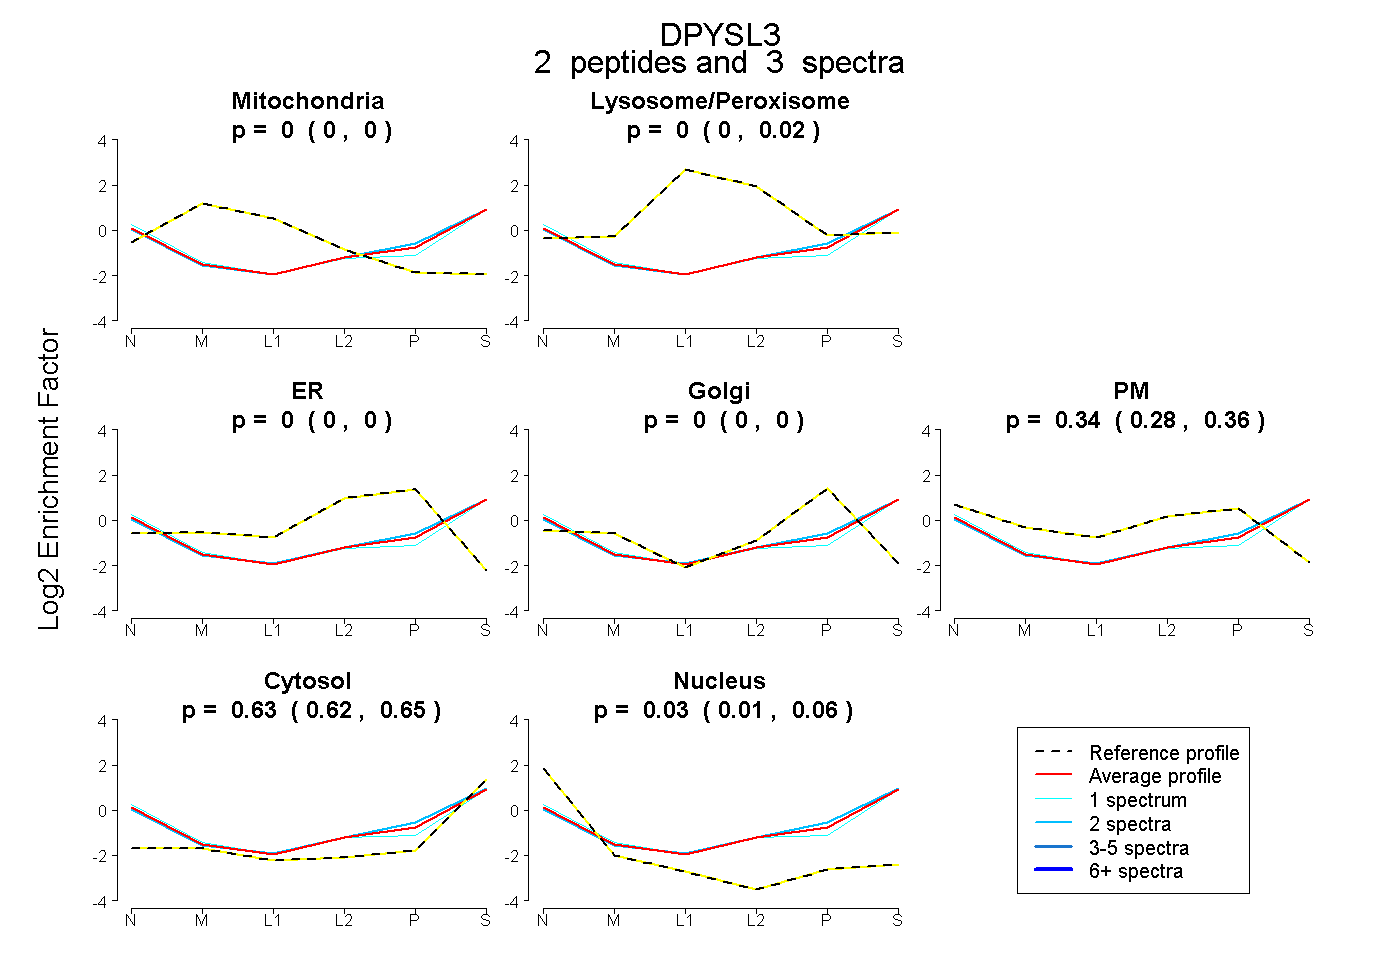
0.000 | 0.000
0.000 | 0.021
0.000 | 0.000
0.000 | 0.000
0.281 | 0.358
0.619 | 0.647
0.009 | 0.056
6peptides
spectra
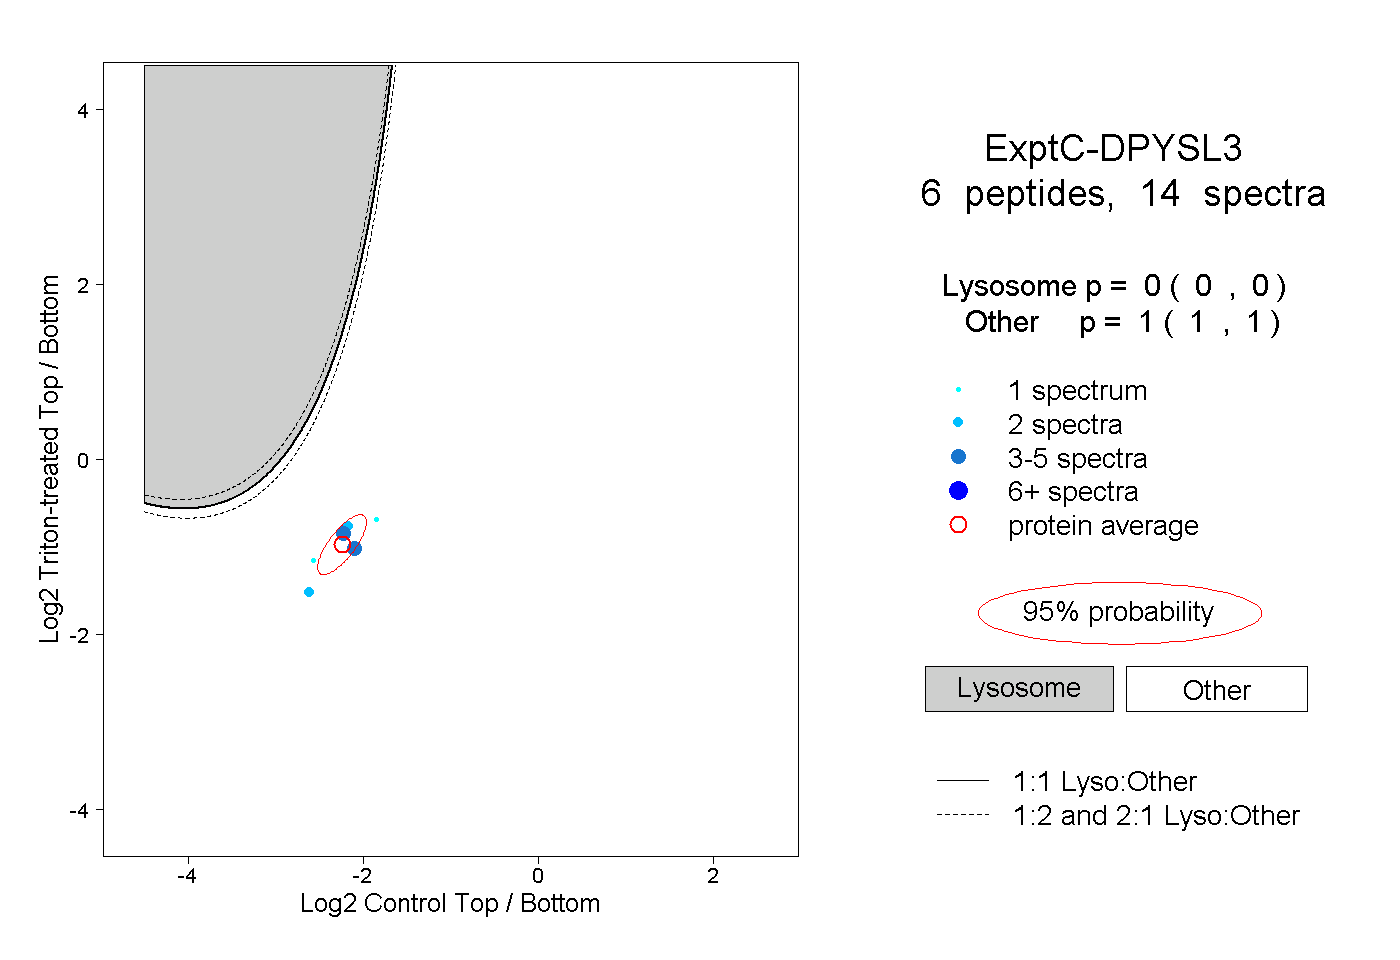
0.000 | 0.000
1.000 | 1.000
1peptide
spectra
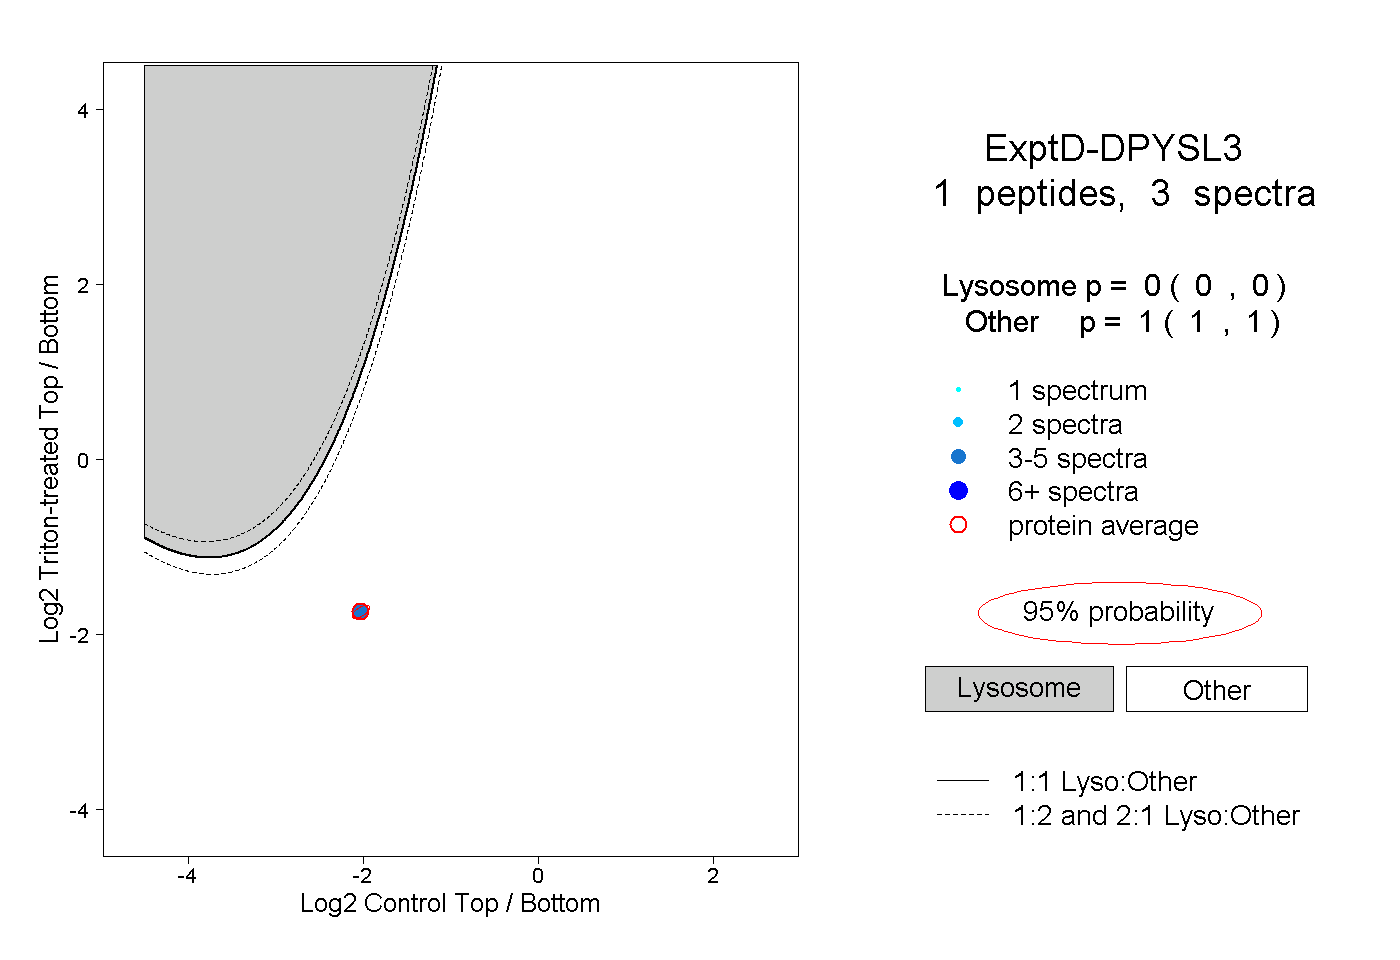
0.000 | 0.000
1.000 | 1.000