 5
5peptides
spectra
0.000 | 0.000
0.000 | 0.000
0.000 | 0.029
0.000 | 0.075
0.000 | 0.000
0.110 | 0.237
0.737 | 0.774
0.000 | 0.033
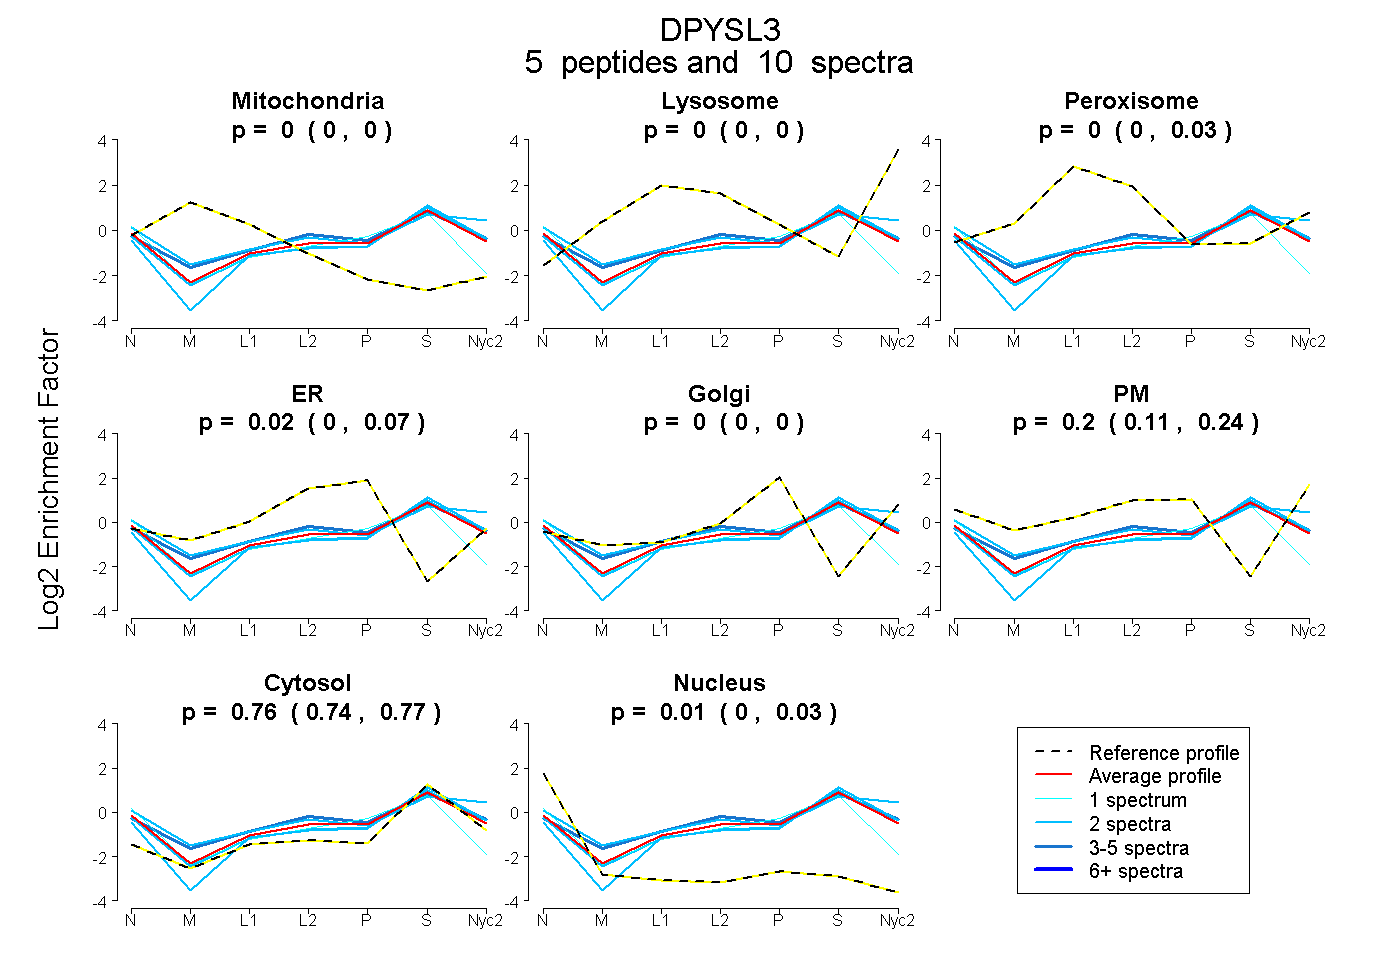
| Plot | Mito | Lyso | Perox | ER | Golgi | PM | Cytosol | Nucleus | |||||
| Expt A |
5 peptides |
10 spectra |
|
0.000 0.000 | 0.000 |
0.000 0.000 | 0.000 |
0.003 0.000 | 0.029 |
0.020 0.000 | 0.075 |
0.000 0.000 | 0.000 |
0.202 0.110 | 0.237 |
0.761 0.737 | 0.774 |
0.015 0.000 | 0.033 |
| 2 spectra, SAADLISQAR | 0.000 | 0.000 | 0.000 | 0.000 | 0.000 | 0.110 | 0.890 | 0.000 | ||
| 3 spectra, EWADGK | 0.000 | 0.000 | 0.089 | 0.034 | 0.000 | 0.192 | 0.684 | 0.000 | ||
| 2 spectra, GSPTRPNPPVR | 0.000 | 0.000 | 0.000 | 0.000 | 0.000 | 0.179 | 0.802 | 0.019 | ||
| 1 spectrum, MADLHAVPR | 0.000 | 0.000 | 0.000 | 0.200 | 0.000 | 0.000 | 0.659 | 0.141 | ||
| 2 spectra, IFNLYPR | 0.000 | 0.000 | 0.046 | 0.000 | 0.000 | 0.329 | 0.625 | 0.000 |
| Plot | Mito | Lyso or Perox | ER | Golgi | PM | Cytosol | Nucleus | ||||||
| Expt B |
2 peptides |
3 spectra |
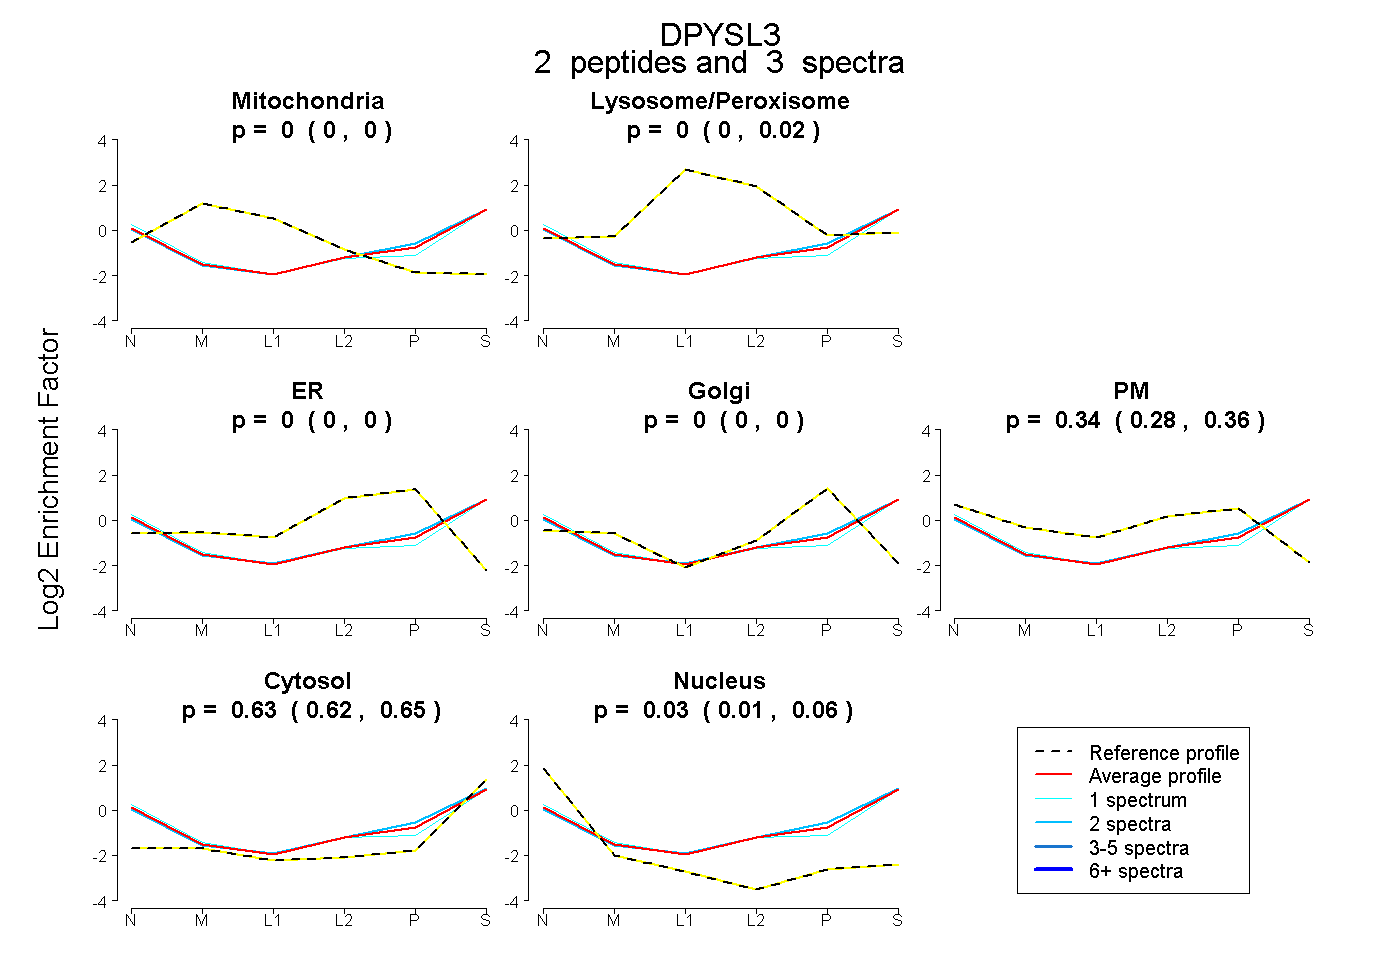 |
0.000 0.000 | 0.000 |
0.000 0.000 | 0.021 |
0.000 0.000 | 0.000 |
0.000 0.000 | 0.000 |
0.336 0.281 | 0.358 |
0.635 0.619 | 0.647 |
0.029 0.009 | 0.056 |
|||
| Plot | Lyso | Other | |||||||||||
| Expt C |
6 peptides |
14 spectra |
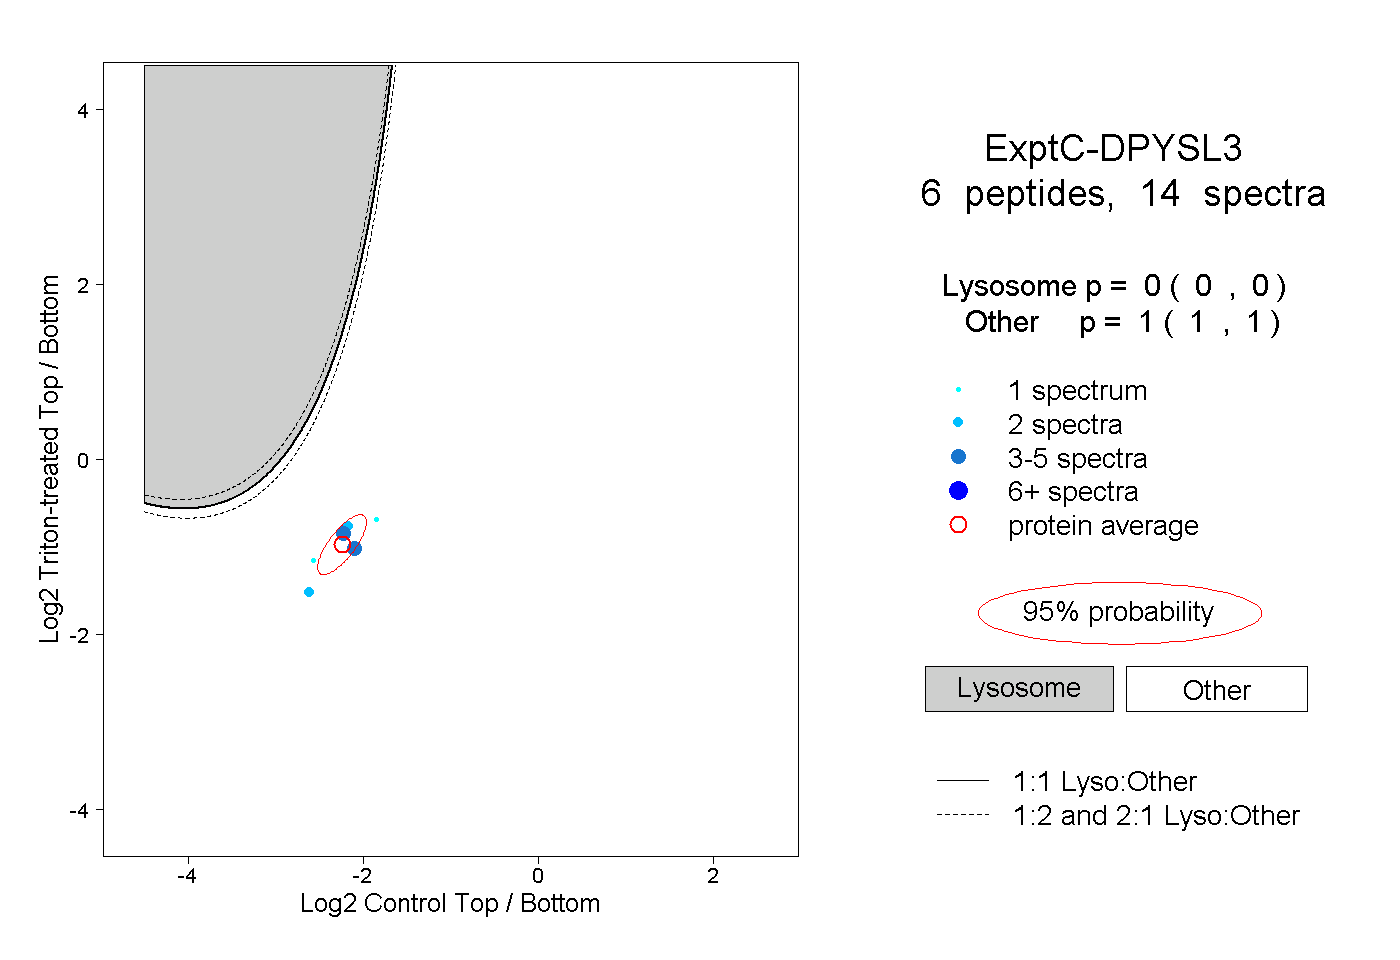 |
0.000 0.000 | 0.000 |
1.000 1.000 | 1.000 |
||||||||
| Plot | Lyso | Other | |||||||||||
| Expt D |
1 peptide |
3 spectra |
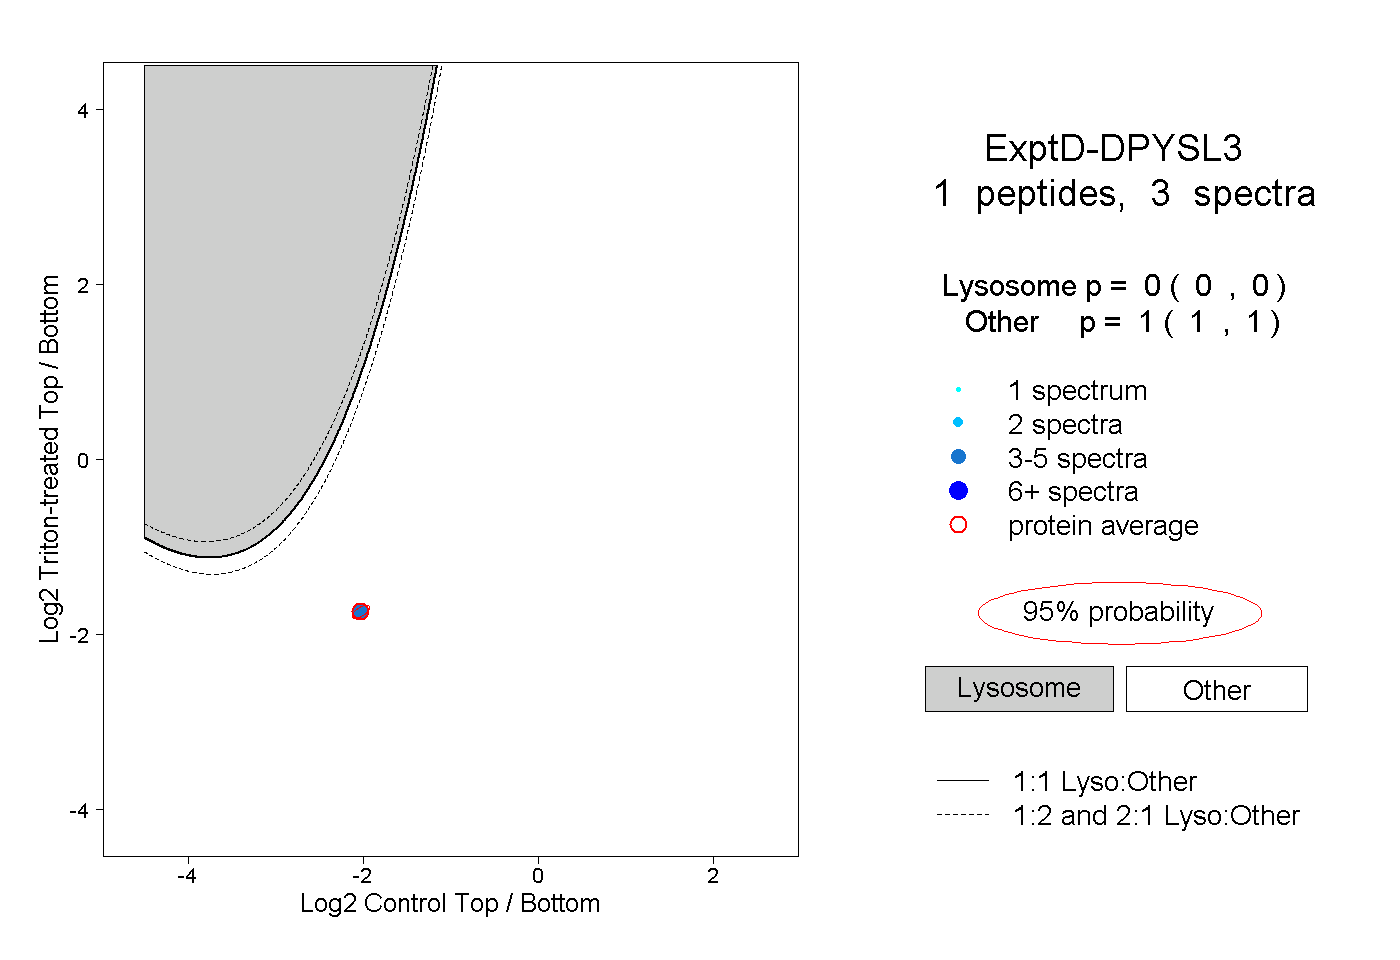 |
0.000 0.000 | 0.000 |
1.000 1.000 | 1.000 |