 7
7peptides
spectra
0.000 | 0.000
0.016 | 0.069
0.000 | 0.036
0.000 | 0.000
0.000 | 0.000
0.412 | 0.441
0.498 | 0.525
0.000 | 0.000
5peptides
spectra
0.000 | 0.000
1.000 | 1.000
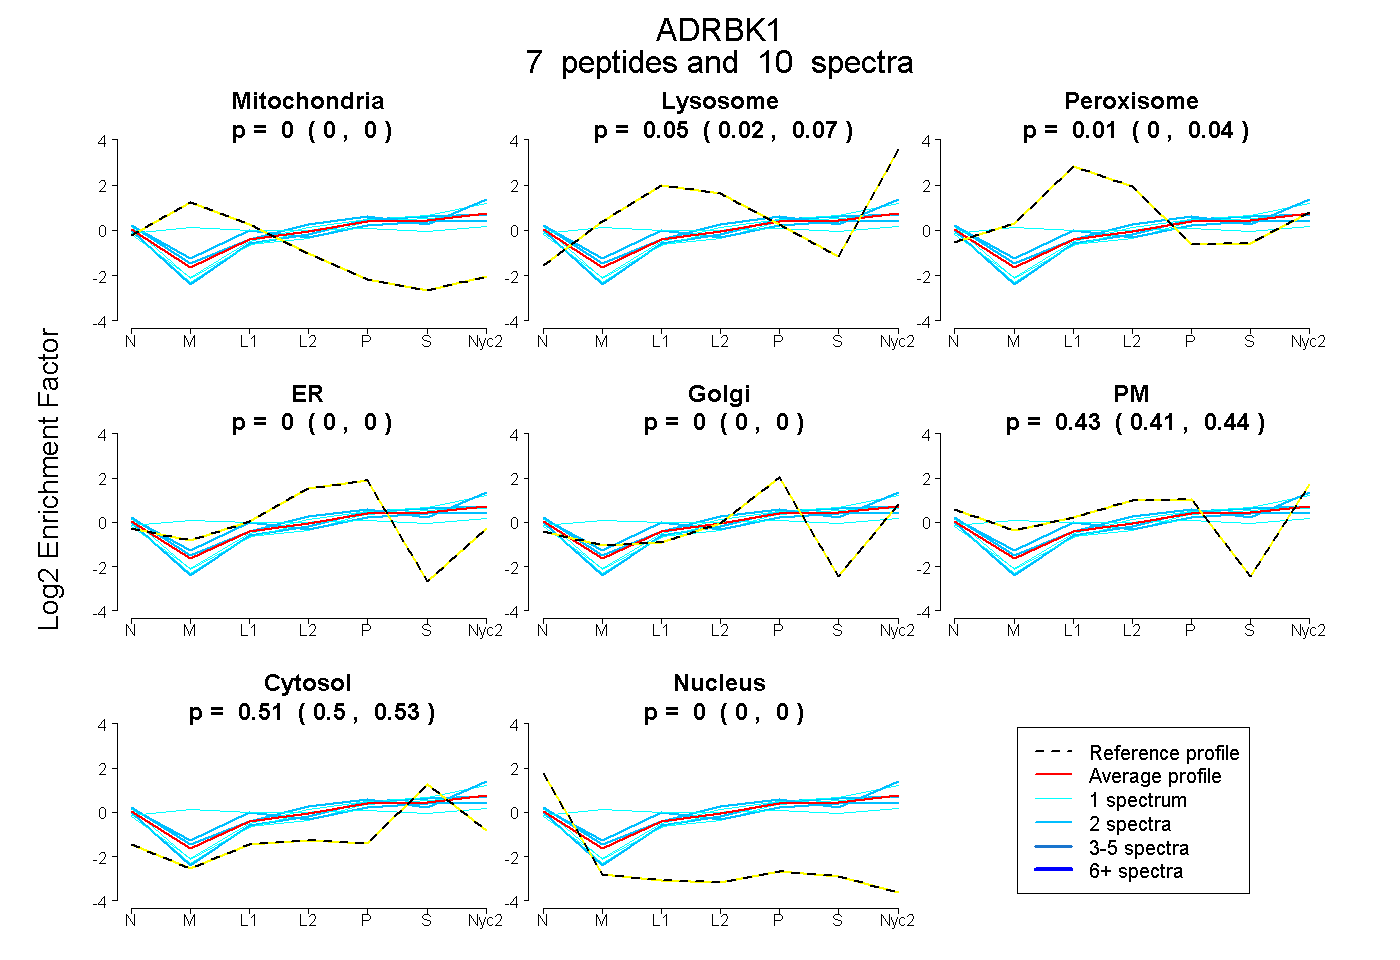
| Plot | Mito | Lyso | Perox | ER | Golgi | PM | Cytosol | Nucleus | |||||
| Expt A |
7 peptides |
10 spectra |
|
0.000 0.000 | 0.000 |
0.050 0.016 | 0.069 |
0.009 0.000 | 0.036 |
0.000 0.000 | 0.000 |
0.000 0.000 | 0.000 |
0.428 0.412 | 0.441 |
0.513 0.498 | 0.525 |
0.000 0.000 | 0.000 |
||
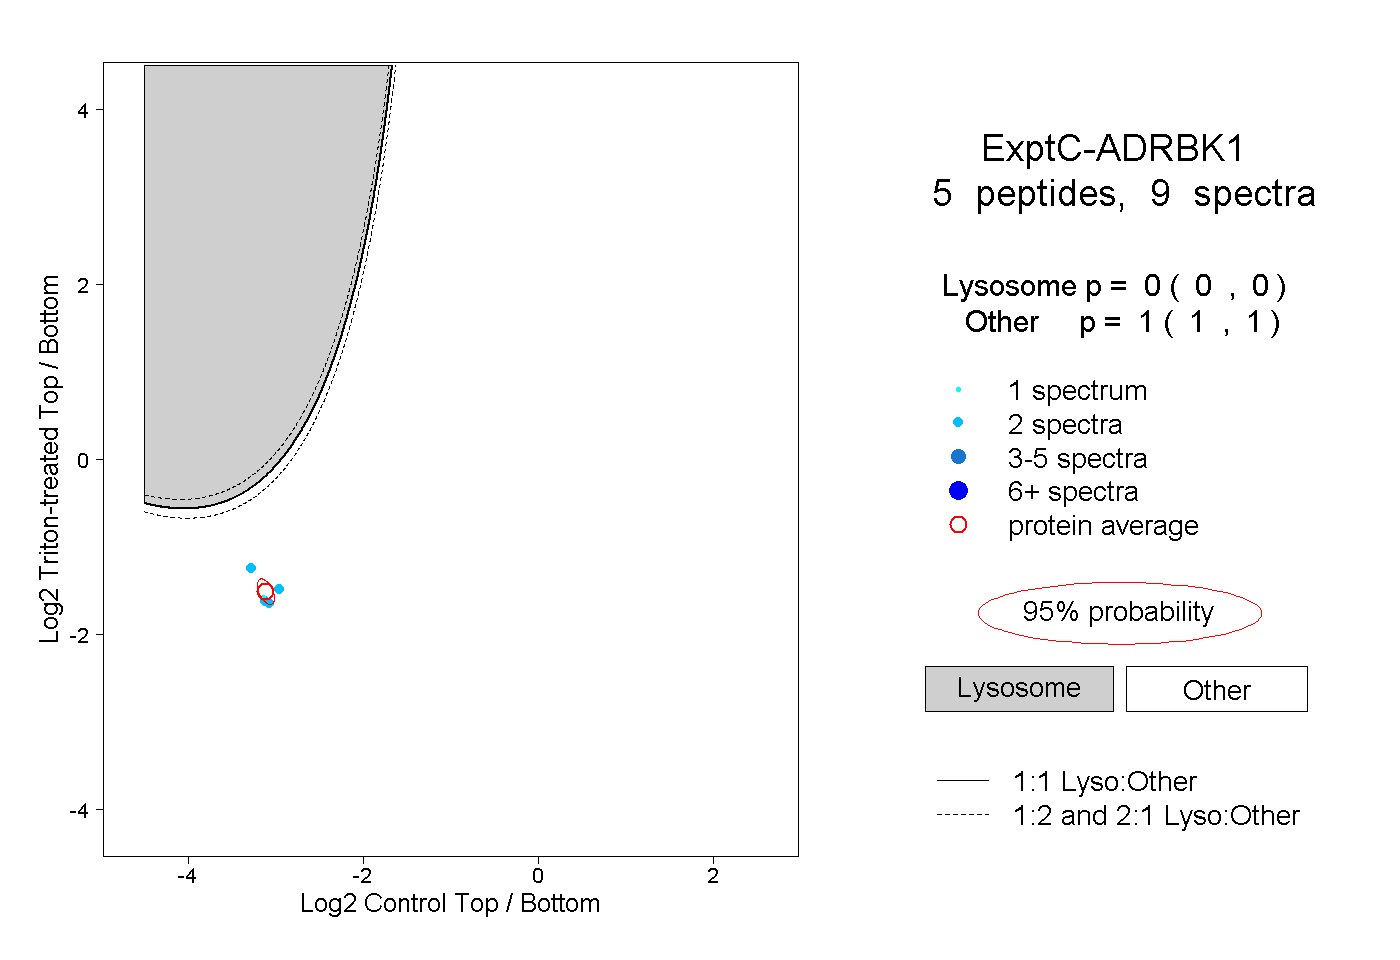
| Plot | Lyso | Other | |||||||||||
| Expt C |
5 peptides |
9 spectra |
|
0.000 0.000 | 0.000 |
1.000 1.000 | 1.000 |