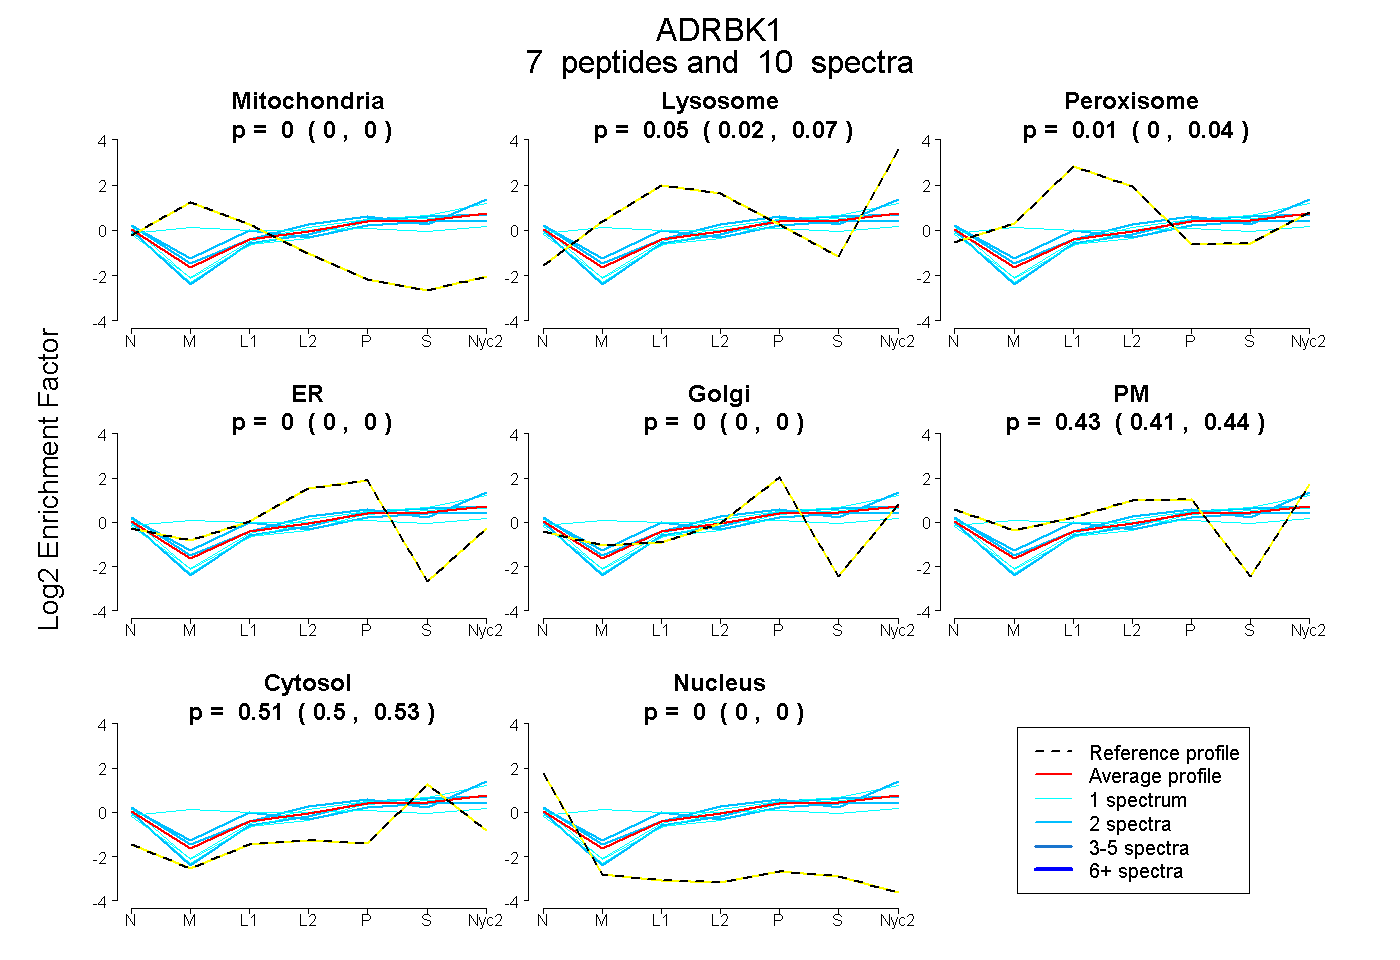
 7
7peptides
spectra
0.000 | 0.000
0.016 | 0.069
0.000 | 0.036
0.000 | 0.000
0.000 | 0.000
0.412 | 0.441
0.498 | 0.525
0.000 | 0.000
| Plot | Mito | Lyso | Perox | ER | Golgi | PM | Cytosol | Nucleus | |||||
| Expt A |
7 peptides |
10 spectra |
|
0.000 0.000 | 0.000 |
0.050 0.016 | 0.069 |
0.009 0.000 | 0.036 |
0.000 0.000 | 0.000 |
0.000 0.000 | 0.000 |
0.428 0.412 | 0.441 |
0.513 0.498 | 0.525 |
0.000 0.000 | 0.000 |
| 1 spectrum, MGNPFLTQWQR | 0.000 | 0.139 | 0.000 | 0.000 | 0.009 | 0.328 | 0.524 | 0.000 | ||
| 2 spectra, YFYLFPNR | 0.000 | 0.109 | 0.000 | 0.000 | 0.000 | 0.476 | 0.415 | 0.000 | ||
| 1 spectrum, EAQQLVQR | 0.000 | 0.000 | 0.000 | 0.000 | 0.010 | 0.393 | 0.596 | 0.000 | ||
| 2 spectra, LLDSDQELYR | 0.000 | 0.000 | 0.000 | 0.000 | 0.013 | 0.409 | 0.578 | 0.000 | ||
| 2 spectra, GAQEVK | 0.000 | 0.000 | 0.140 | 0.000 | 0.000 | 0.373 | 0.486 | 0.000 | ||
| 1 spectrum, SLLEGLLQR | 0.000 | 0.000 | 0.000 | 0.000 | 0.000 | 0.447 | 0.553 | 0.000 | ||
| 1 spectrum, YPPPLIPPR | 0.103 | 0.000 | 0.261 | 0.000 | 0.111 | 0.213 | 0.312 | 0.000 |
| Plot | Lyso | Other | |||||||||||
| Expt C |
5 peptides |
9 spectra |
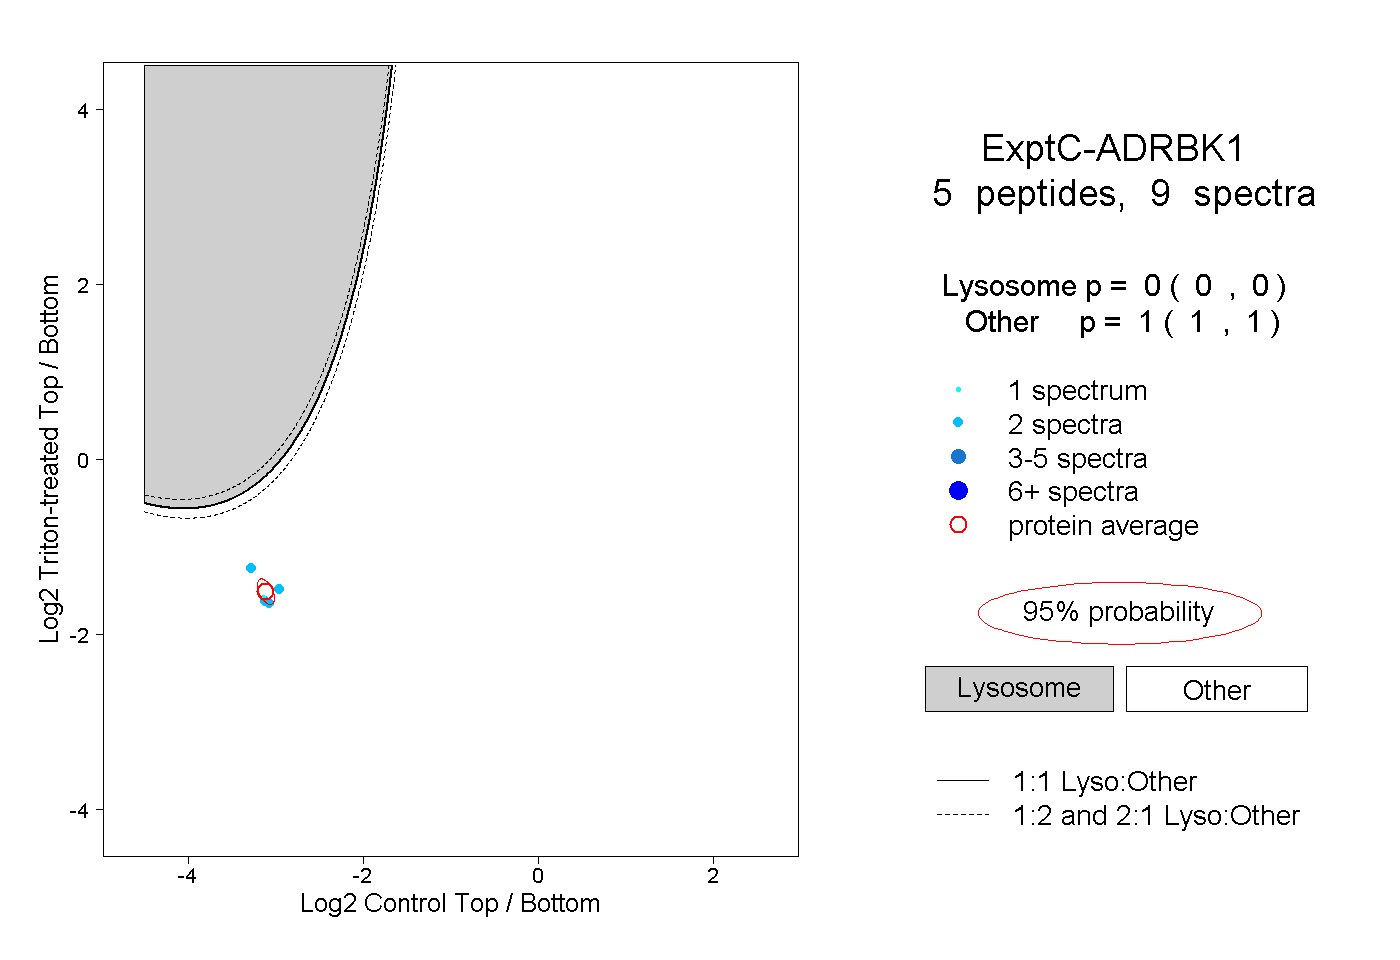 |
0.000 0.000 | 0.000 |
1.000 1.000 | 1.000 |