 10
10peptides
spectra
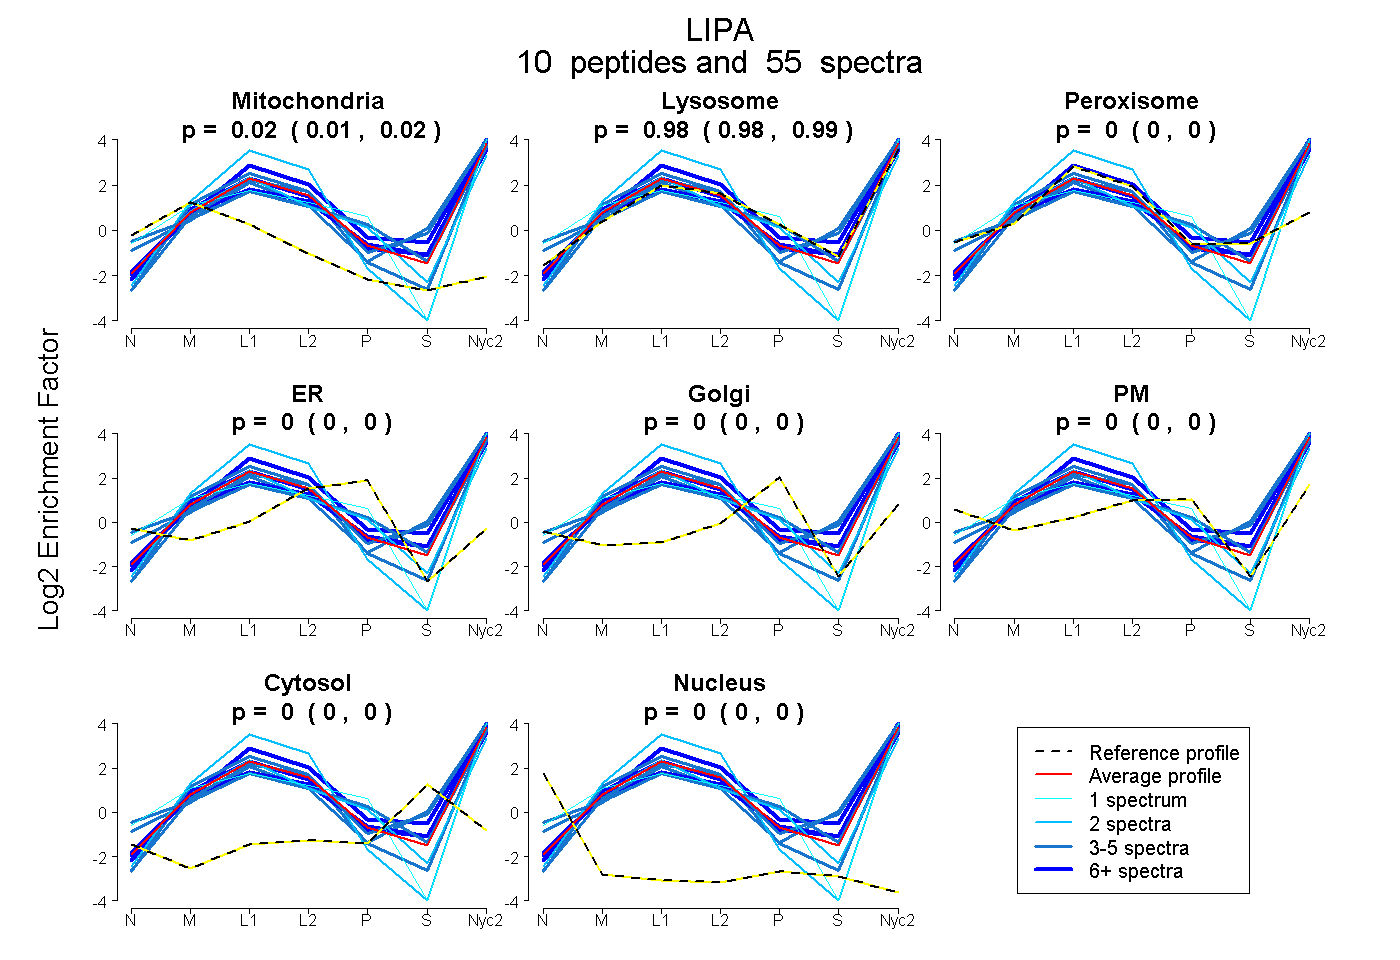
0.012 | 0.021
0.978 | 0.987
0.000 | 0.000
0.000 | 0.000
0.000 | 0.000
0.000 | 0.000
0.000 | 0.000
0.000 | 0.000
5peptides
spectra
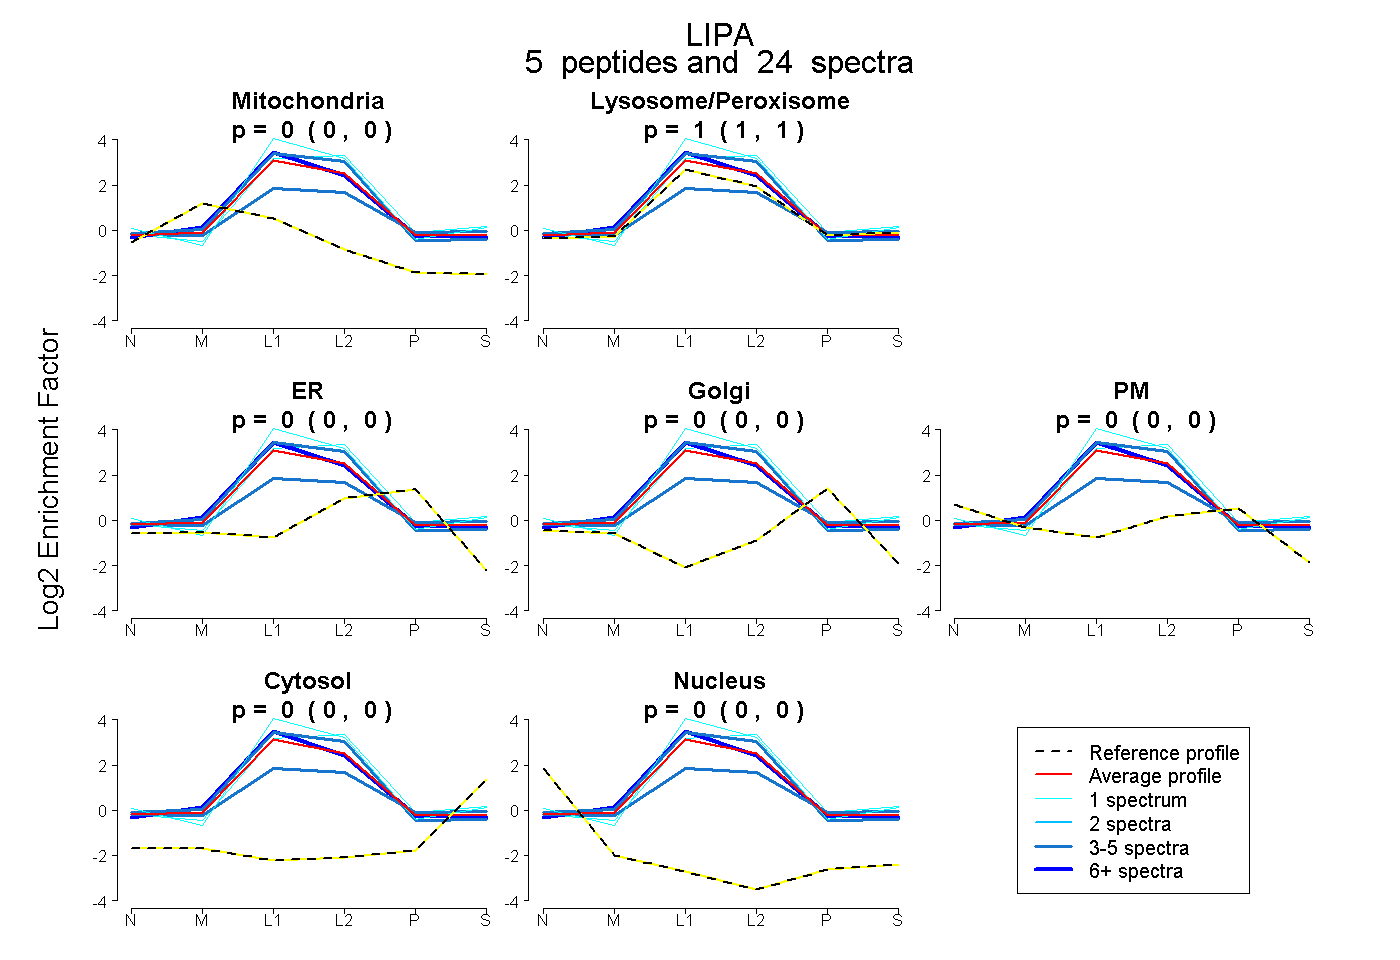
0.000 | 0.000
1.000 | 1.000
0.000 | 0.000
0.000 | 0.000
0.000 | 0.000
0.000 | 0.000
0.000 | 0.000
10peptides
spectra
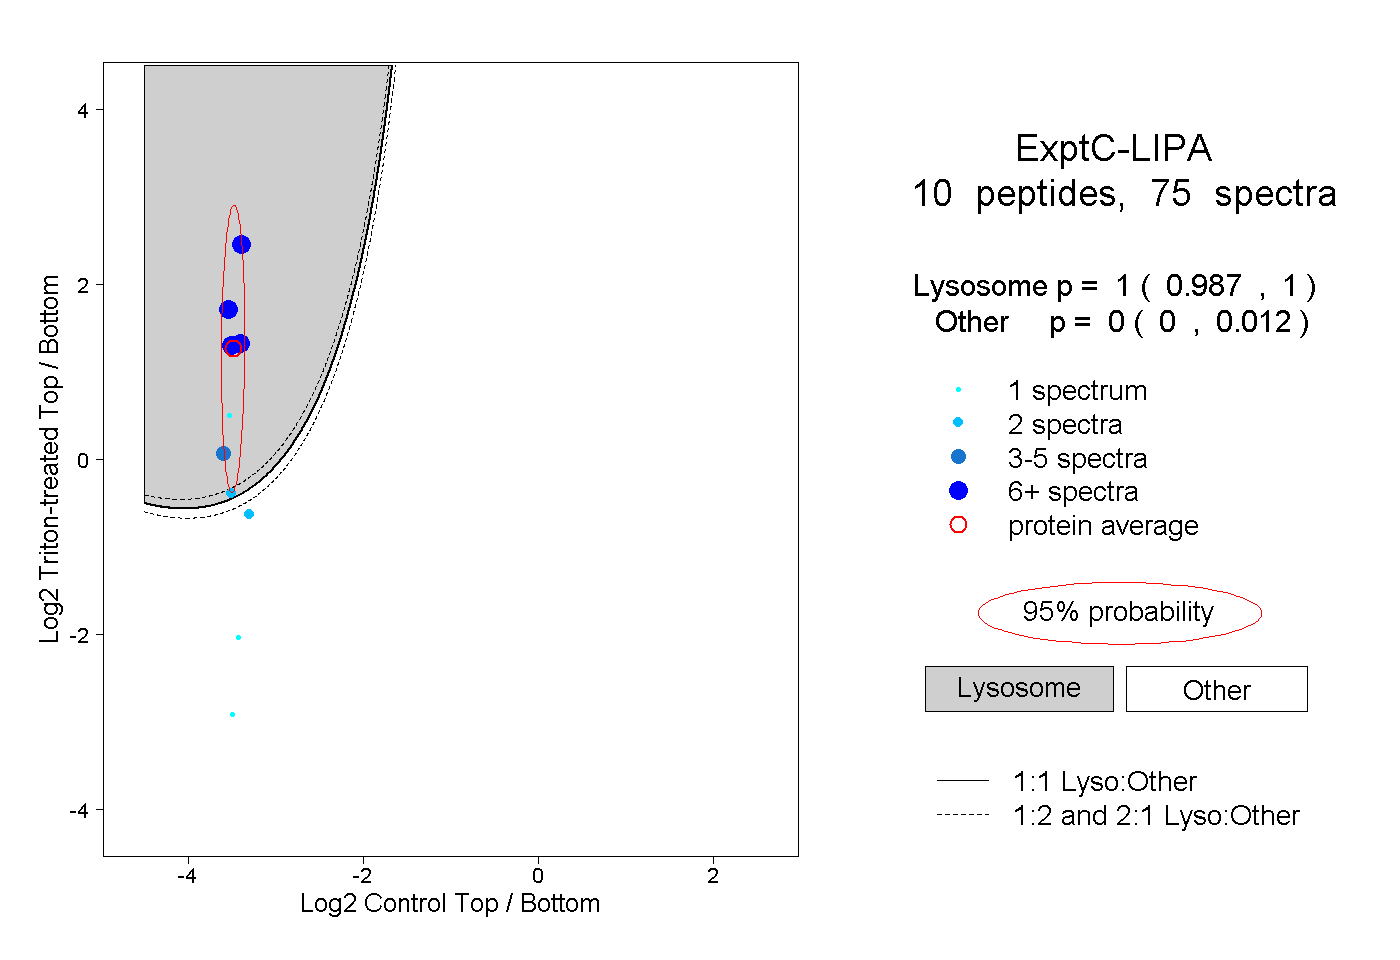
0.987 | 1.000
0.000 | 0.012
3peptides
spectra
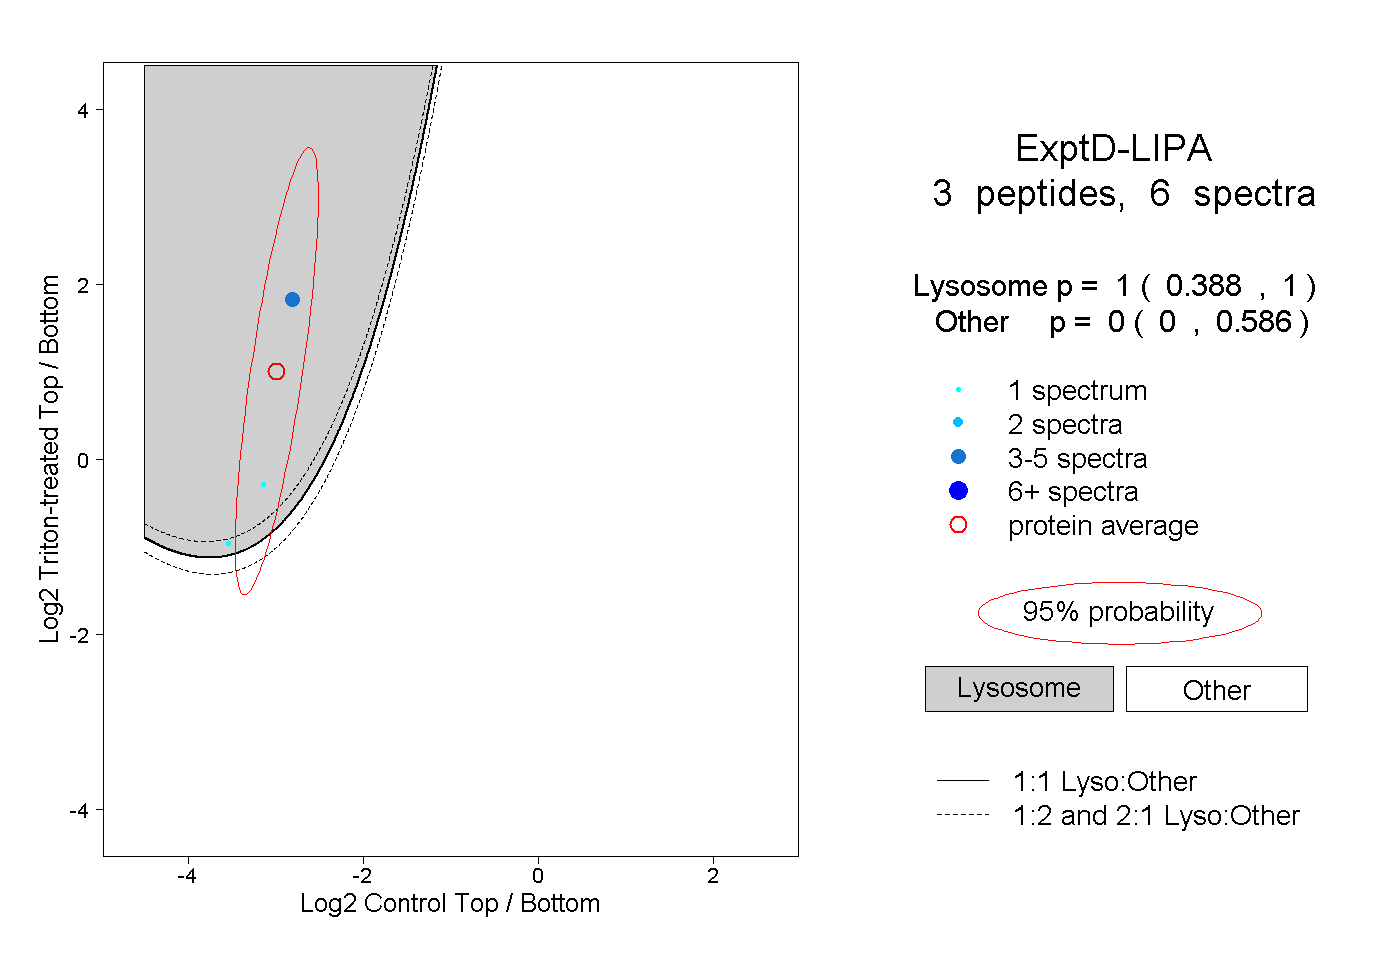
0.388 | 1.000
0.000 | 0.586