 9
9peptides
spectra
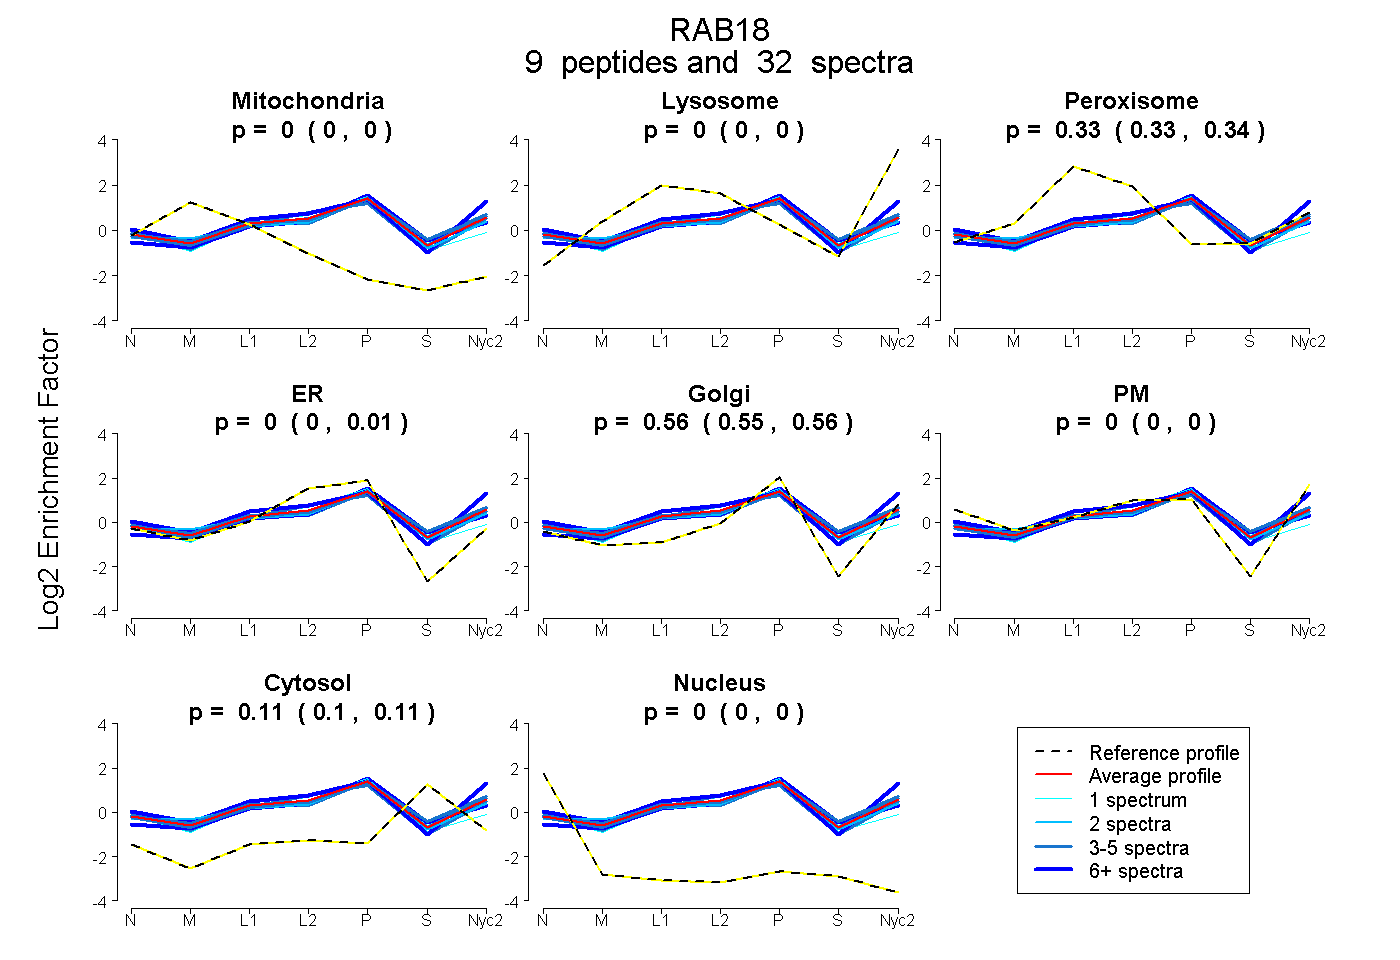
0.000 | 0.000
0.000 | 0.000
0.329 | 0.336
0.000 | 0.005
0.551 | 0.565
0.000 | 0.000
0.101 | 0.110
0.000 | 0.000
8peptides
spectra
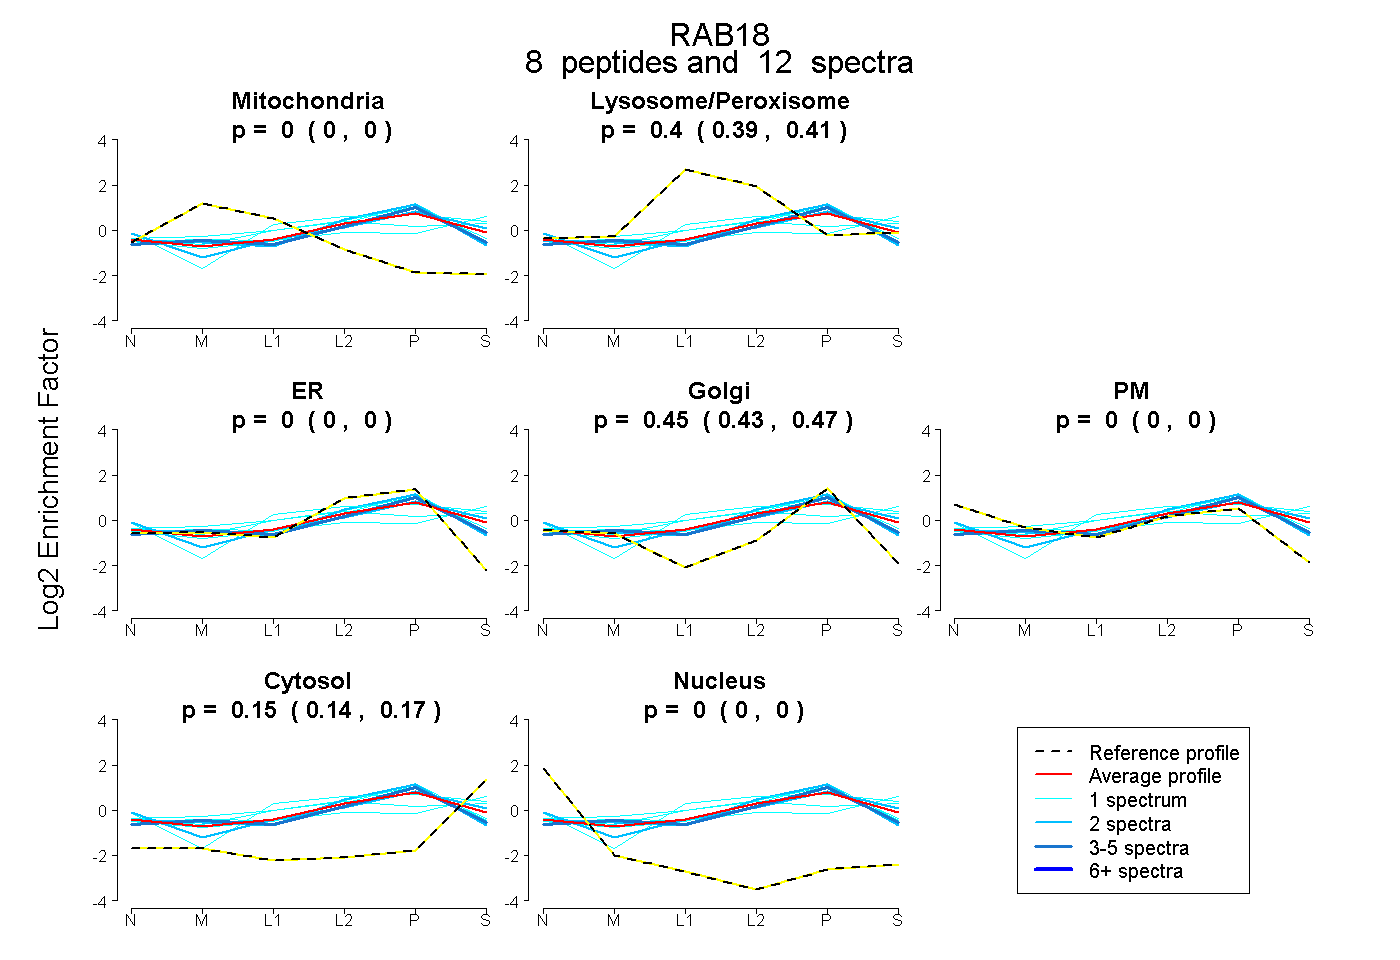
0.000 | 0.000
0.385 | 0.409
0.000 | 0.000
0.427 | 0.467
0.000 | 0.000
0.135 | 0.166
0.000 | 0.000
7peptides
spectra
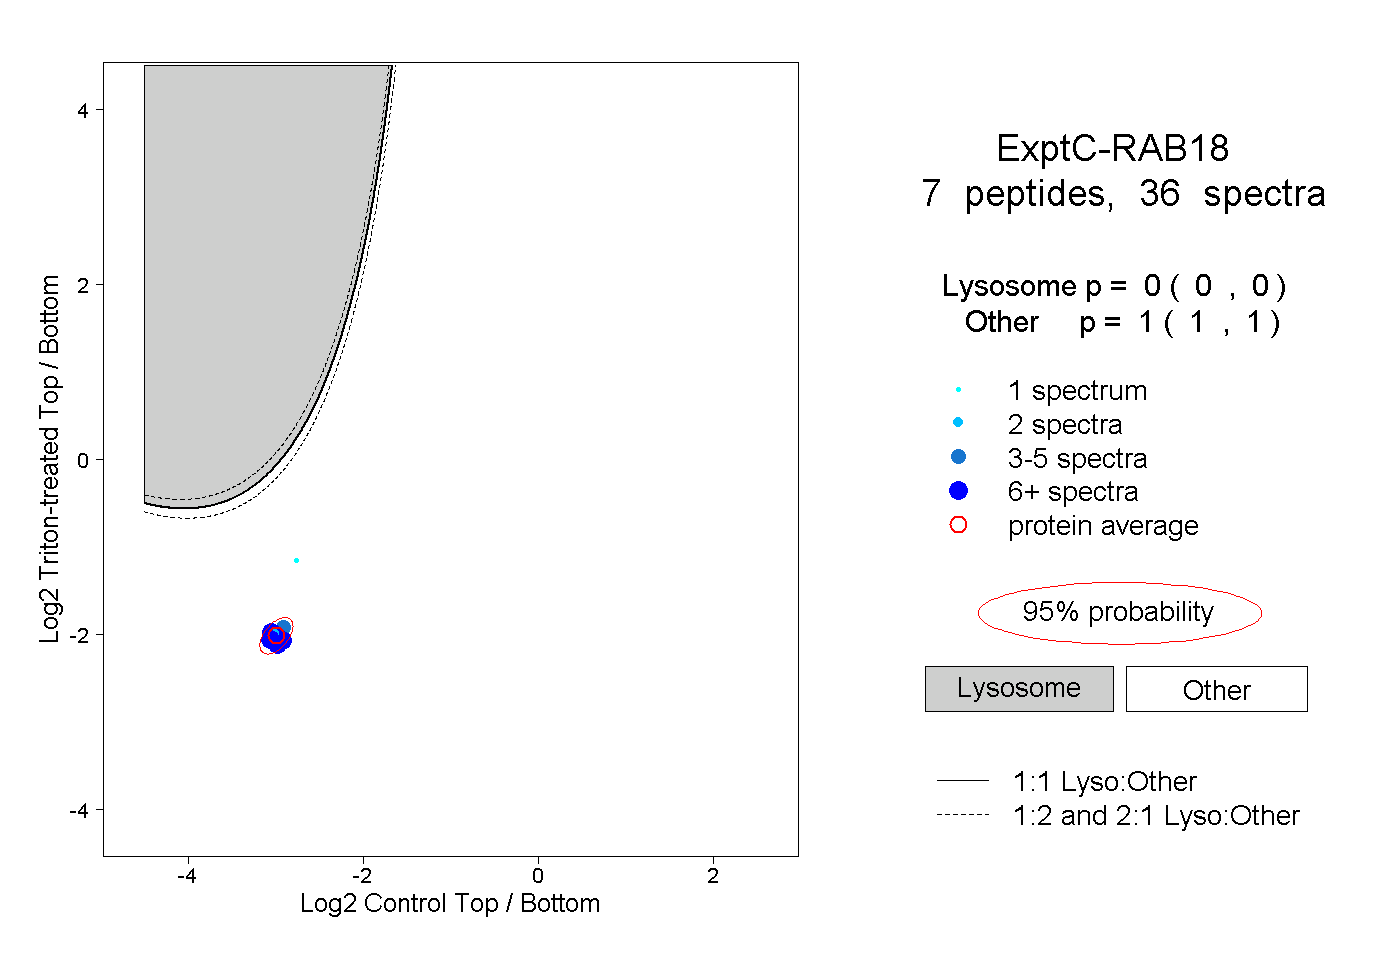
0.000 | 0.000
1.000 | 1.000
3peptides
spectra
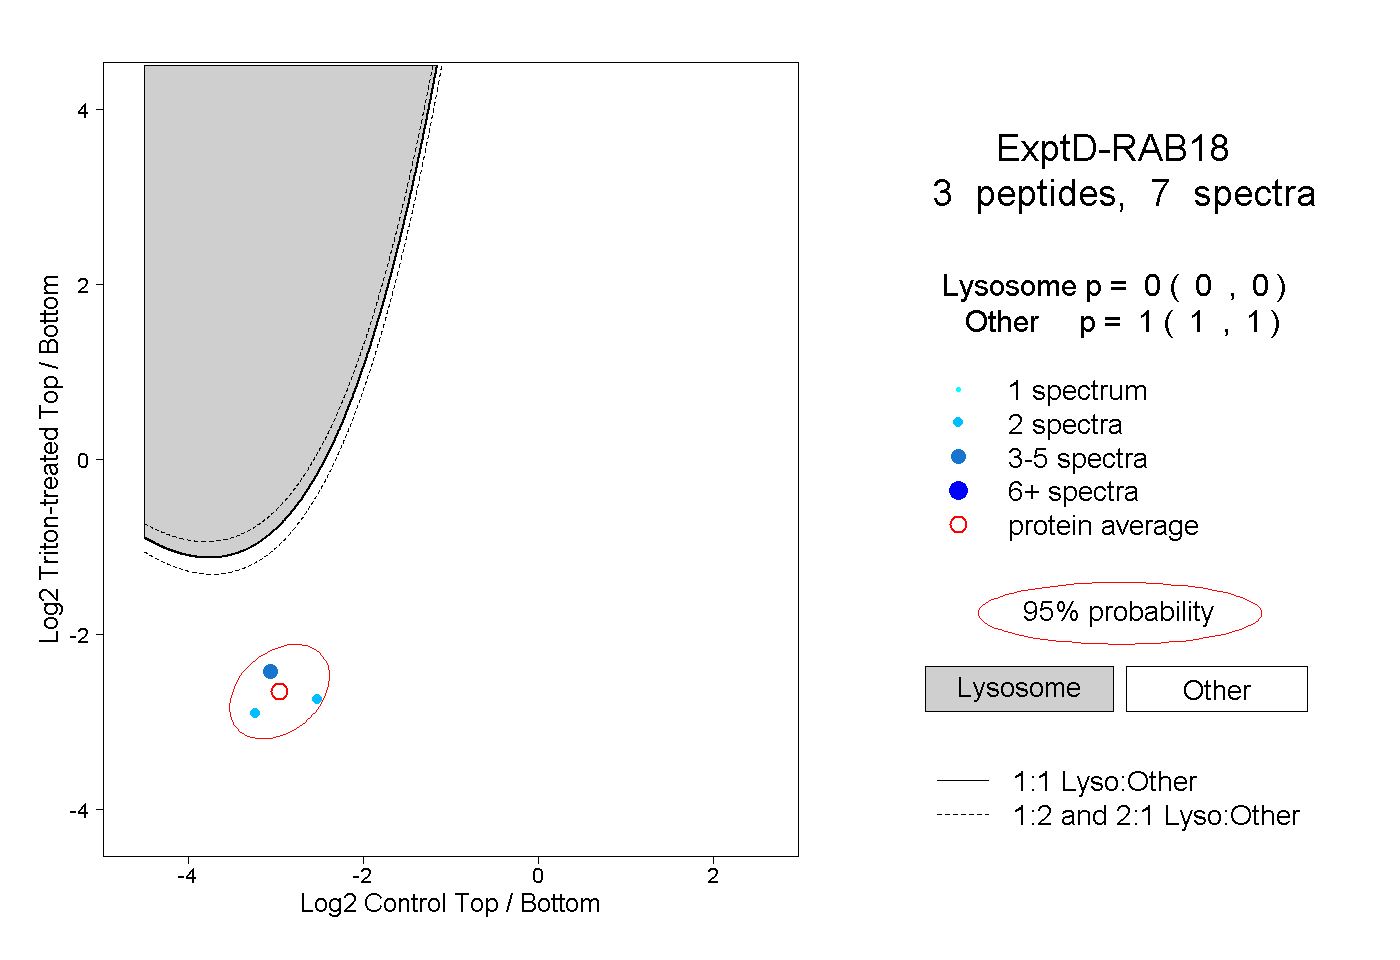
0.000 | 0.000
1.000 | 1.000