 9
9peptides
spectra
0.000 | 0.000
0.000 | 0.000
0.329 | 0.336
0.000 | 0.005
0.551 | 0.565
0.000 | 0.000
0.101 | 0.110
0.000 | 0.000
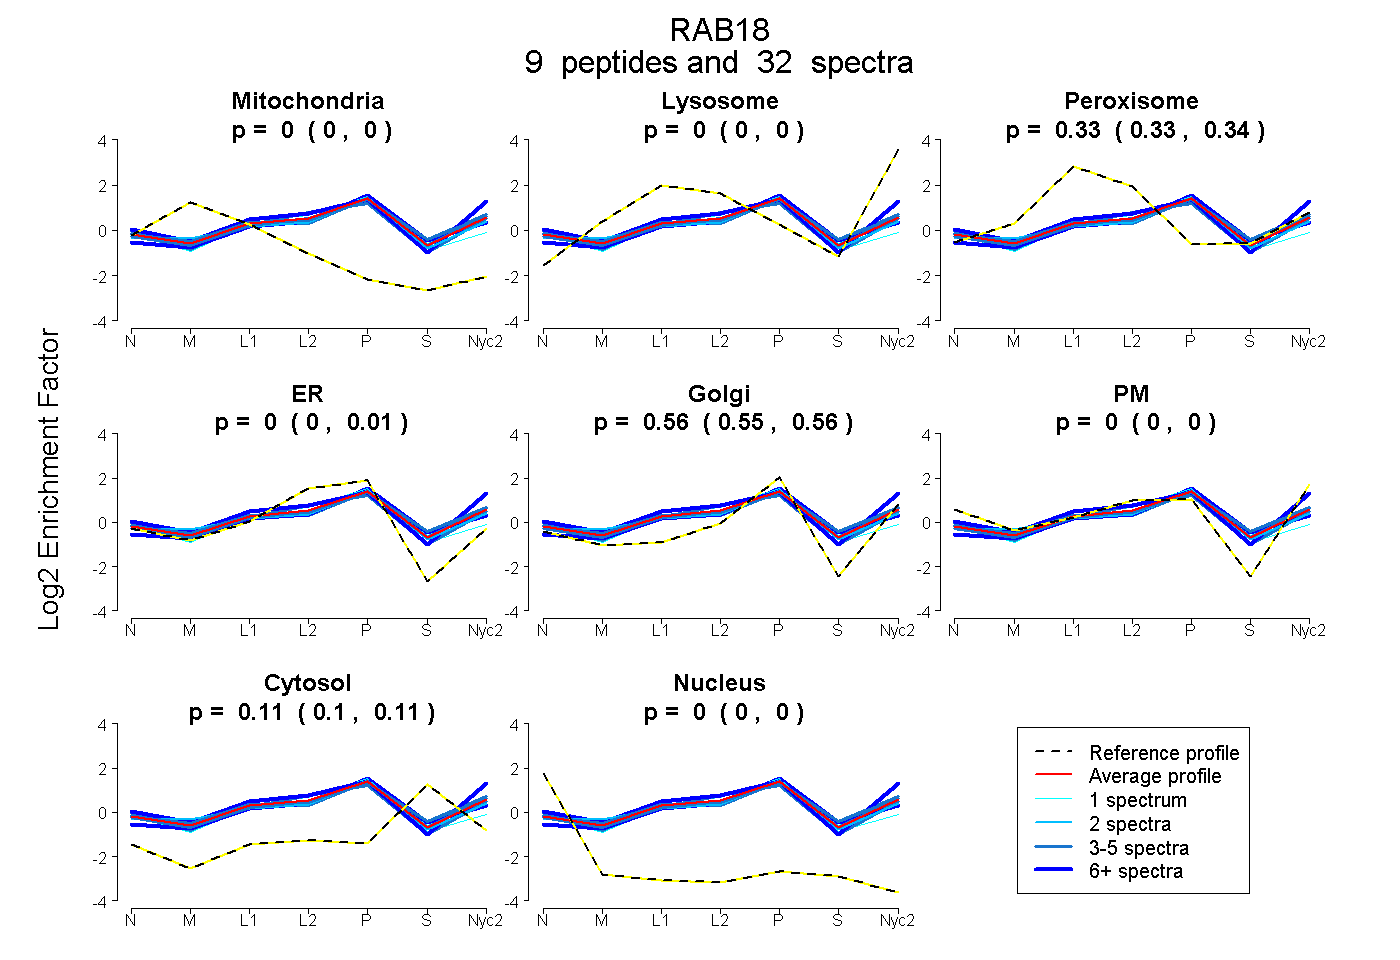
| Plot | Mito | Lyso | Perox | ER | Golgi | PM | Cytosol | Nucleus | |||||
| Expt A |
9 peptides |
32 spectra |
|
0.000 0.000 | 0.000 |
0.000 0.000 | 0.000 |
0.334 0.329 | 0.336 |
0.000 0.000 | 0.005 |
0.560 0.551 | 0.565 |
0.000 0.000 | 0.000 |
0.106 0.101 | 0.110 |
0.000 0.000 | 0.000 |
| 6 spectra, LAIWDTAGQER | 0.000 | 0.000 | 0.270 | 0.062 | 0.490 | 0.000 | 0.179 | 0.000 | ||
| 1 spectrum, LDNWLNELETYCTR | 0.000 | 0.000 | 0.255 | 0.351 | 0.261 | 0.000 | 0.132 | 0.000 | ||
| 3 spectra, GAQGVILVYDVTR | 0.000 | 0.002 | 0.307 | 0.000 | 0.532 | 0.000 | 0.158 | 0.000 | ||
| 5 spectra, TLTPSYYR | 0.000 | 0.000 | 0.341 | 0.000 | 0.556 | 0.000 | 0.103 | 0.000 | ||
| 8 spectra, SSLLLR | 0.000 | 0.080 | 0.232 | 0.000 | 0.362 | 0.269 | 0.057 | 0.000 | ||
| 1 spectrum, ILIIGESGVGK | 0.000 | 0.000 | 0.303 | 0.011 | 0.560 | 0.000 | 0.126 | 0.000 | ||
| 3 spectra, NDIVNMLVGNK | 0.000 | 0.000 | 0.250 | 0.163 | 0.315 | 0.148 | 0.124 | 0.000 | ||
| 2 spectra, TCDGVQCAFEELVEK | 0.000 | 0.000 | 0.309 | 0.000 | 0.585 | 0.000 | 0.106 | 0.000 | ||
| 3 spectra, TISVDGNK | 0.000 | 0.000 | 0.329 | 0.000 | 0.524 | 0.000 | 0.147 | 0.000 |
| Plot | Mito | Lyso or Perox | ER | Golgi | PM | Cytosol | Nucleus | ||||||
| Expt B |
8 peptides |
12 spectra |
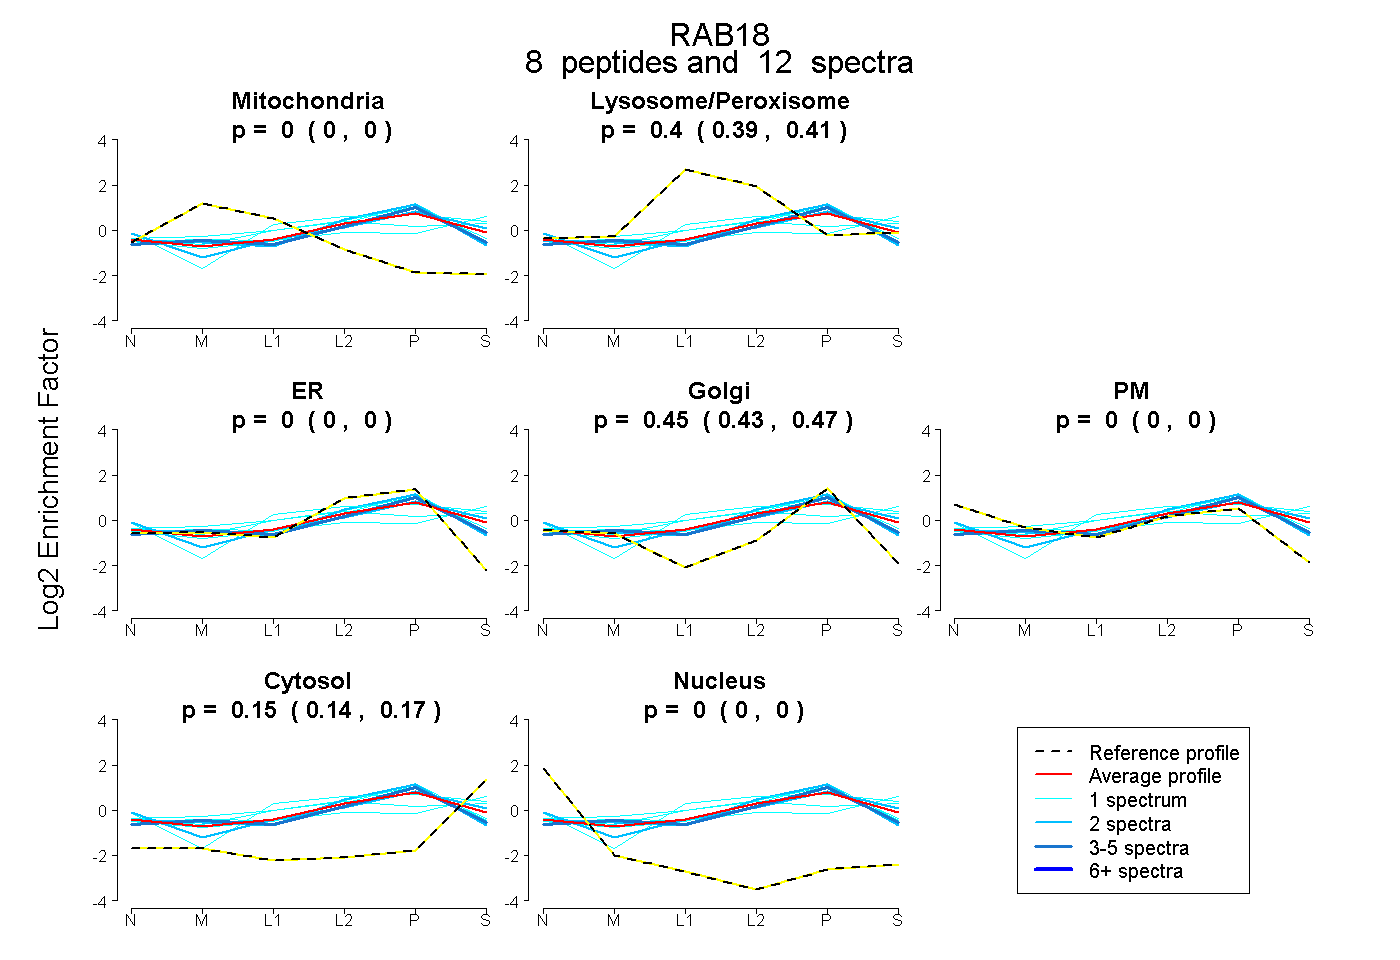 |
0.000 0.000 | 0.000 |
0.398 0.385 | 0.409 |
0.000 0.000 | 0.000 |
0.449 0.427 | 0.467 |
0.000 0.000 | 0.000 |
0.153 0.135 | 0.166 |
0.000 0.000 | 0.000 |
|||
| Plot | Lyso | Other | |||||||||||
| Expt C |
7 peptides |
36 spectra |
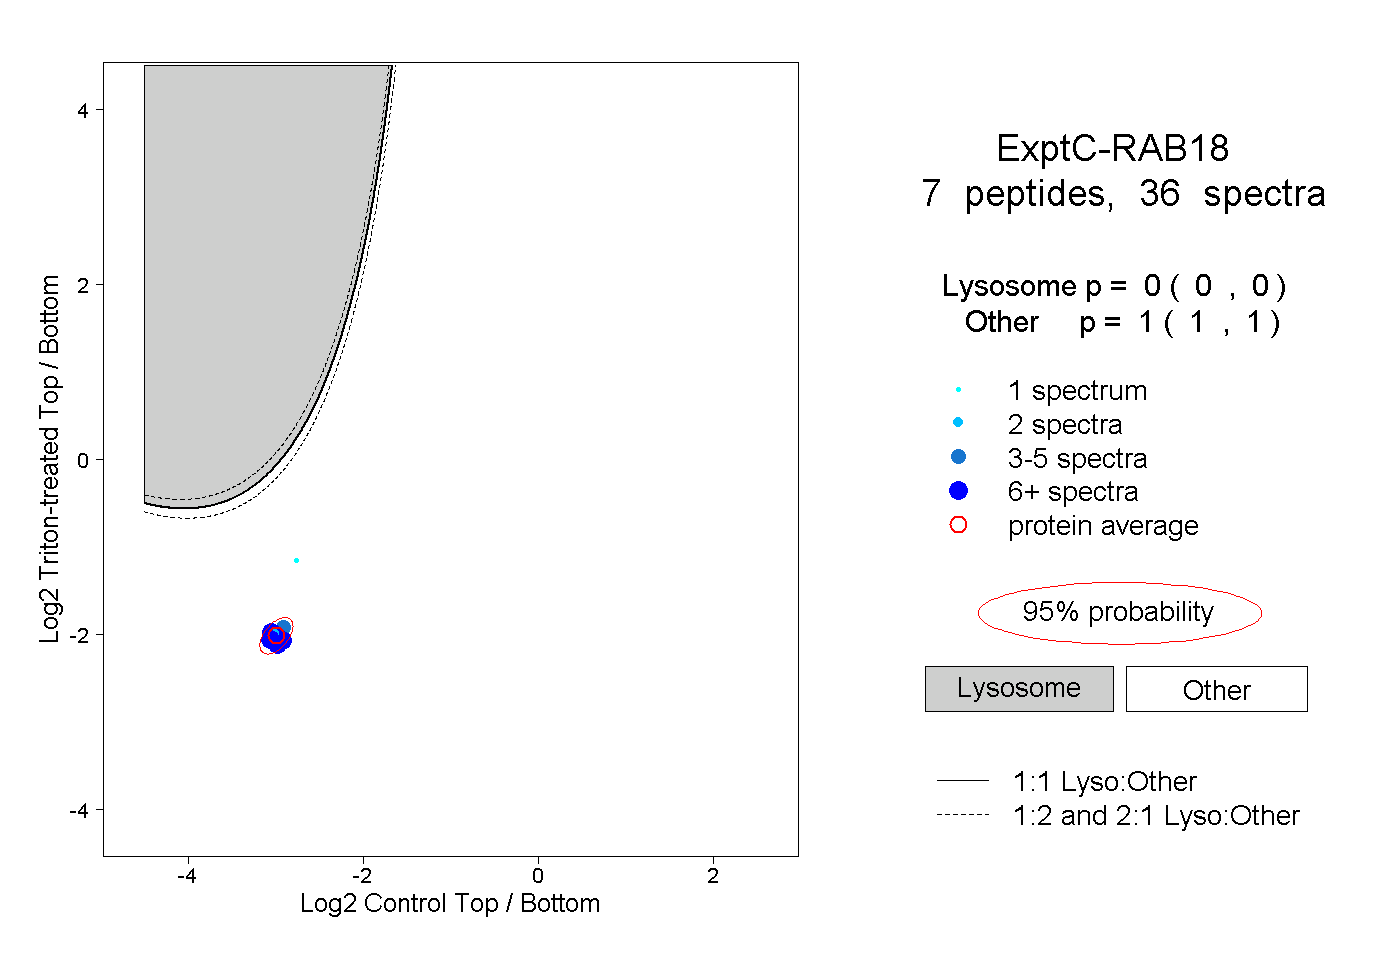 |
0.000 0.000 | 0.000 |
1.000 1.000 | 1.000 |
||||||||
| Plot | Lyso | Other | |||||||||||
| Expt D |
3 peptides |
7 spectra |
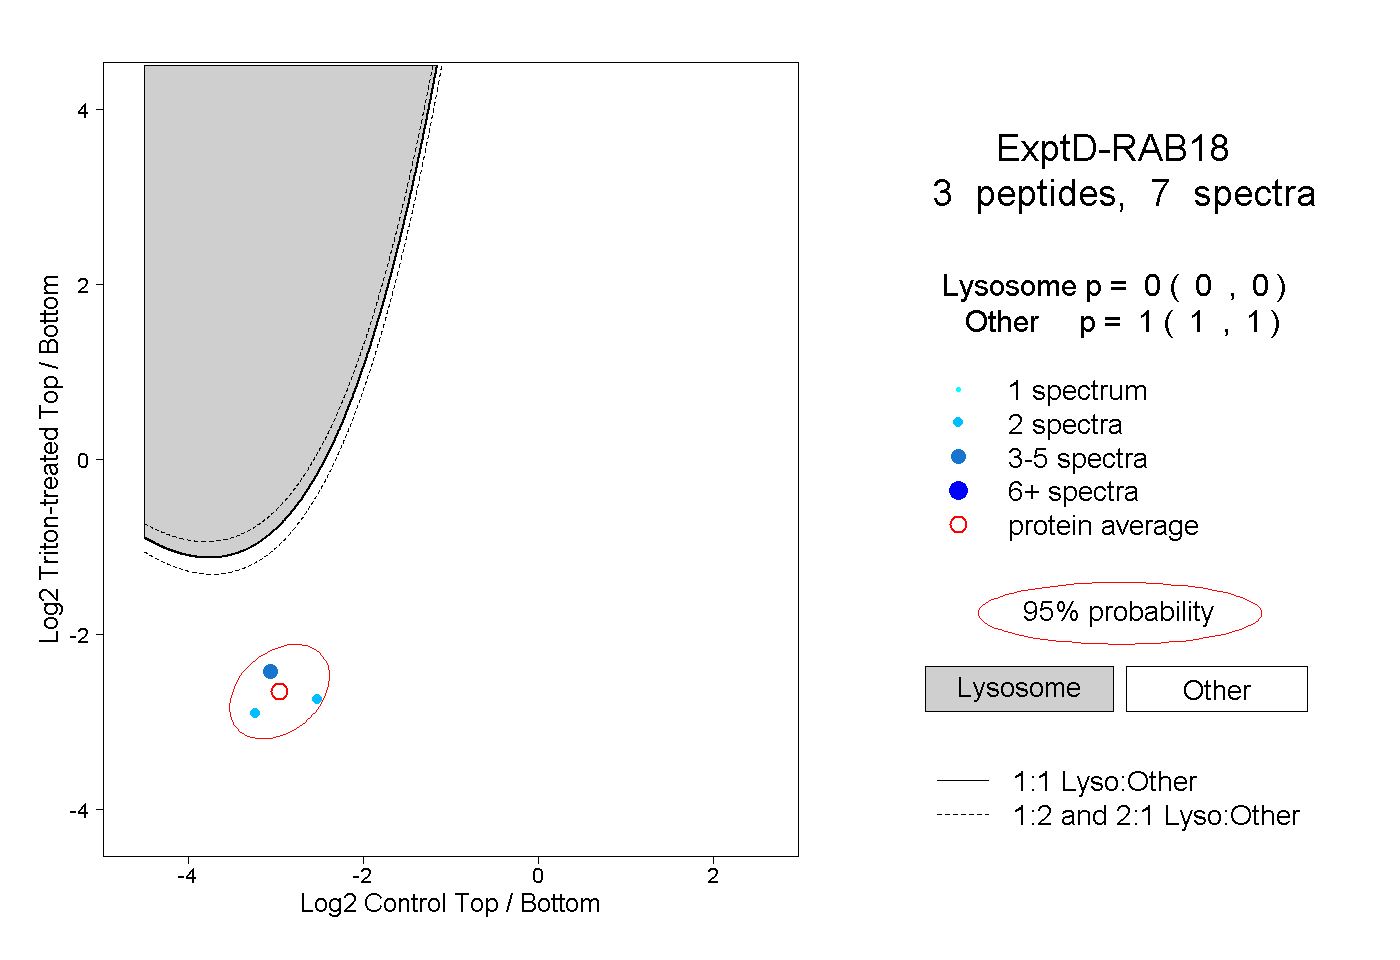 |
0.000 0.000 | 0.000 |
1.000 1.000 | 1.000 |