 5
5peptides
spectra
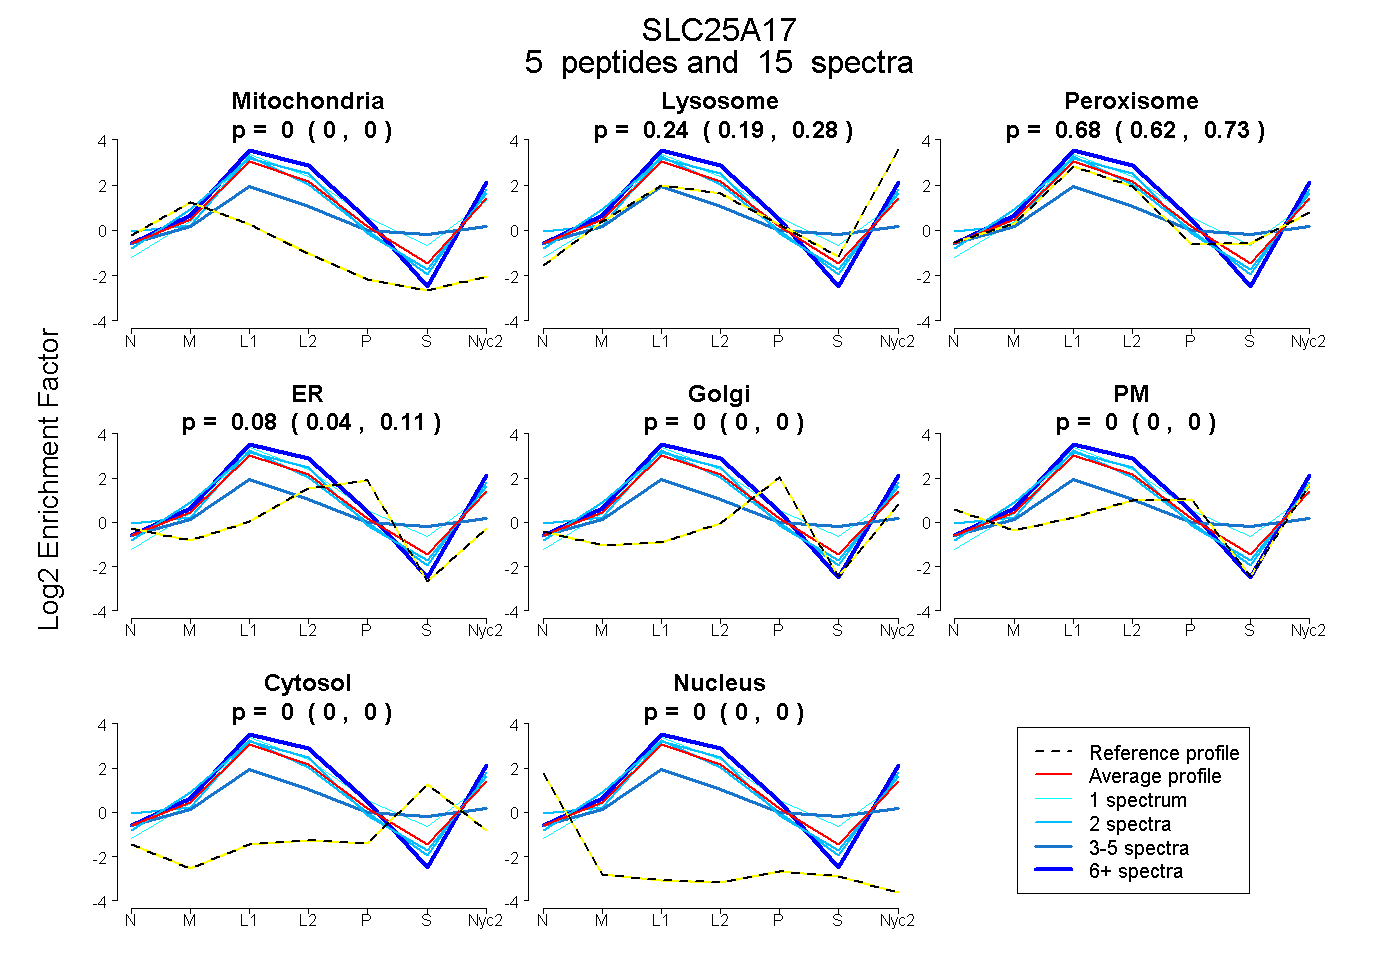
0.000 | 0.000
0.185 | 0.279
0.624 | 0.731
0.043 | 0.108
0.000 | 0.000
0.000 | 0.000
0.000 | 0.000
0.000 | 0.000
3peptides
spectra
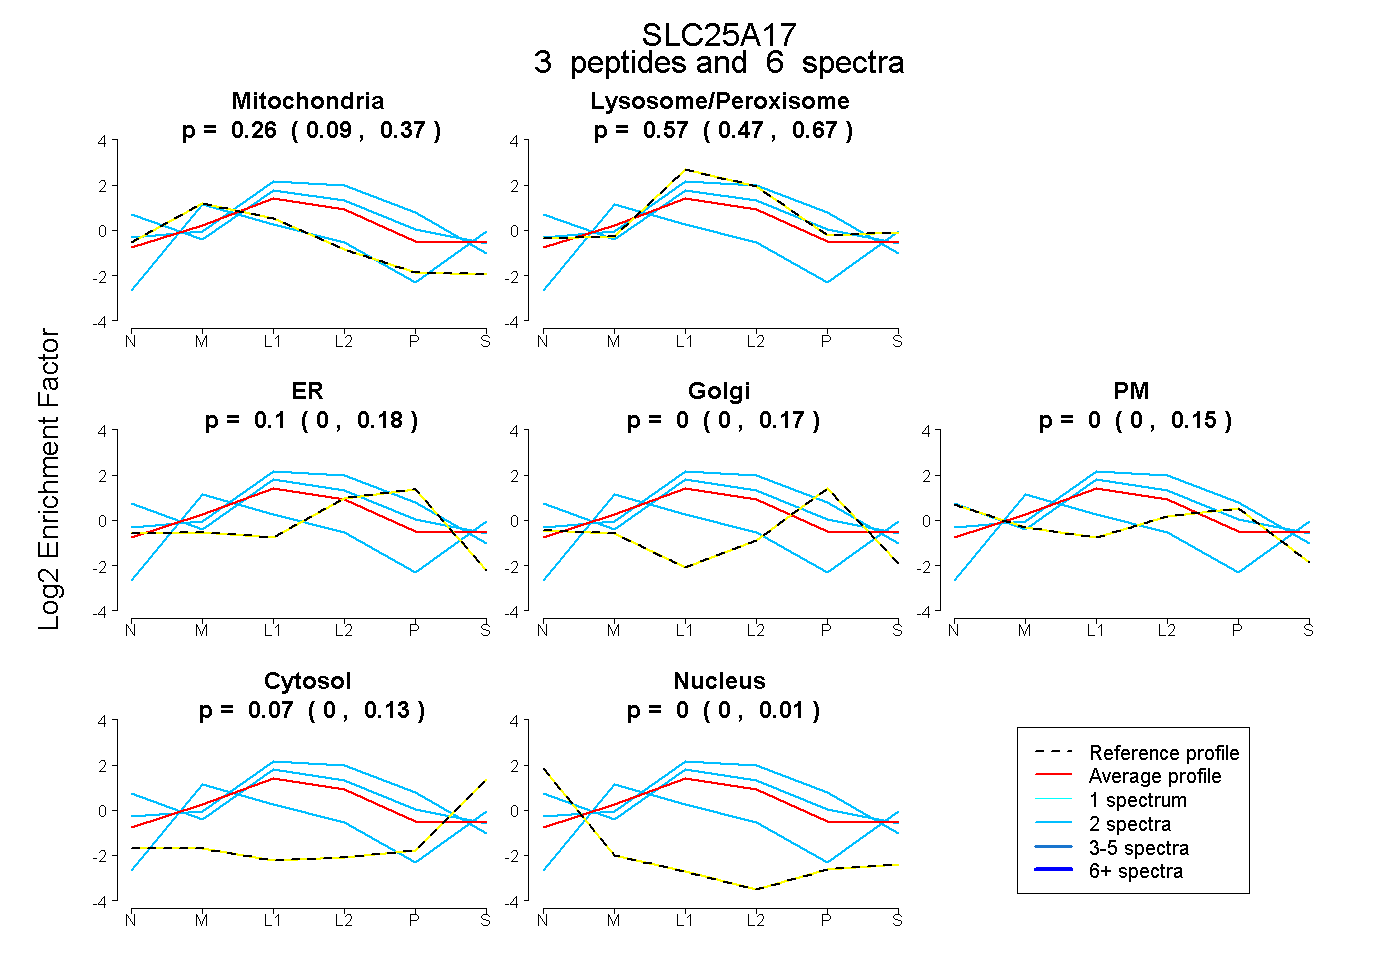
0.089 | 0.368
0.470 | 0.670
0.000 | 0.178
0.000 | 0.171
0.000 | 0.155
0.000 | 0.134
0.000 | 0.009
9peptides
spectra
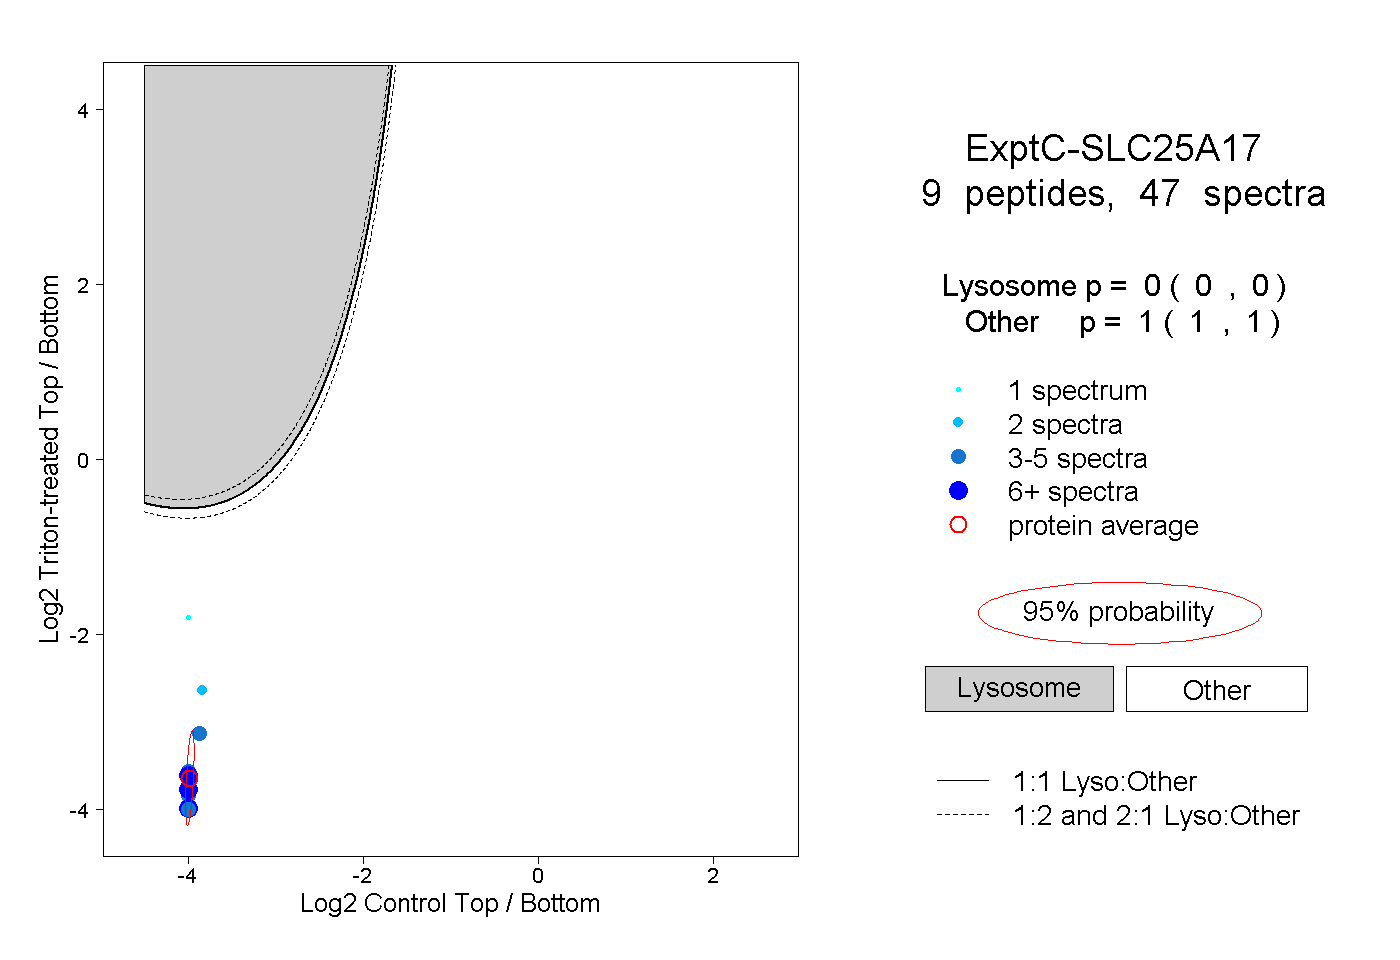
0.000 | 0.000
1.000 | 1.000
2peptides
spectra
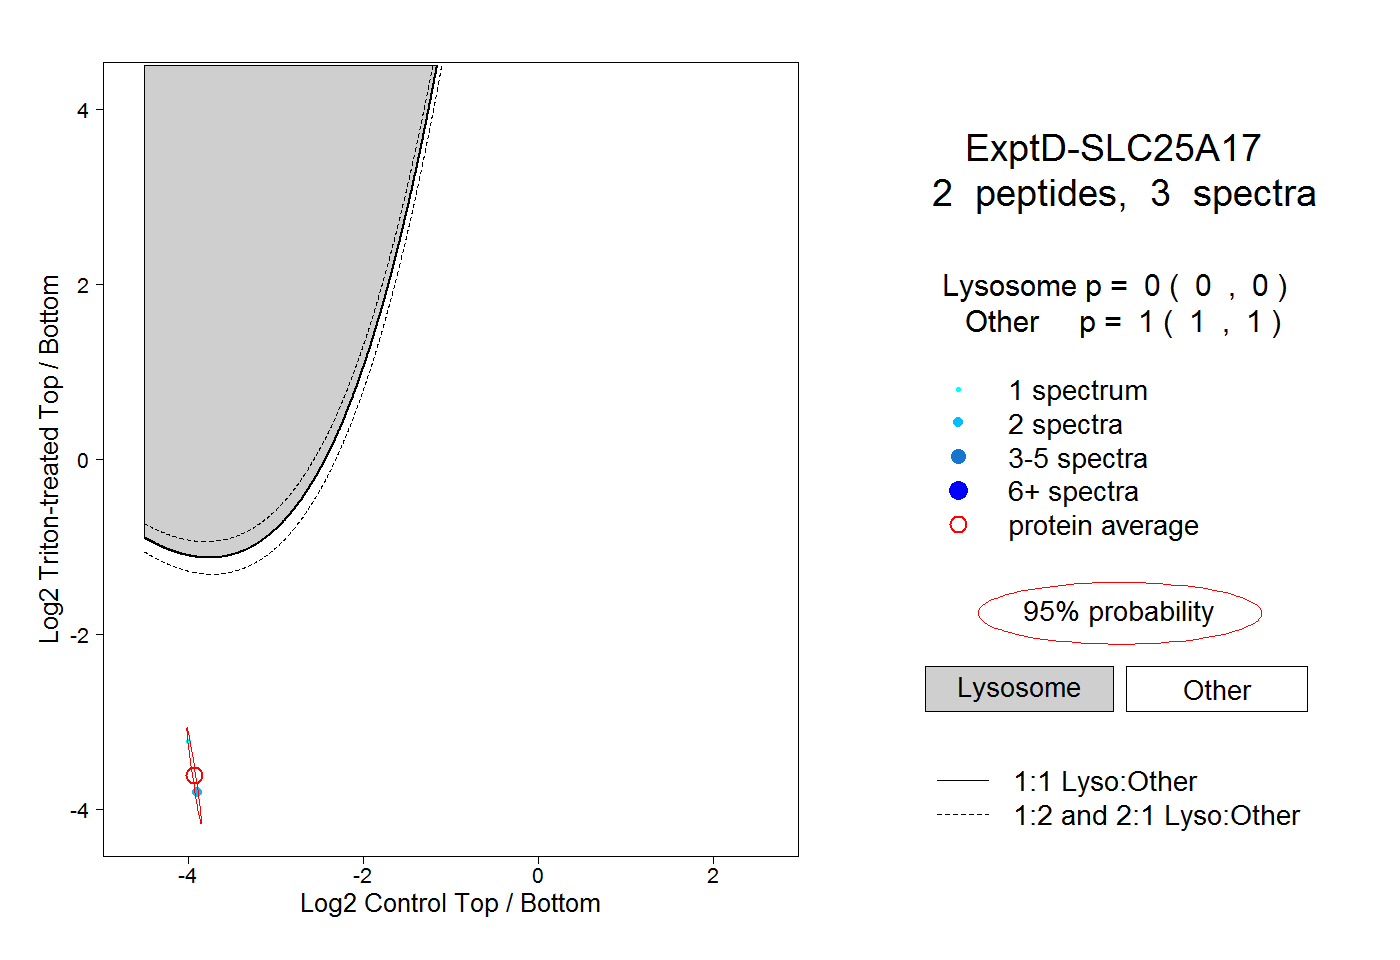
0.000 | 0.000
1.000 | 1.000