SLC25A17
[ENSRNOP00000025758]
Main page
| | | Plot |
Mito |
Lyso |
|
Perox |
ER |
Golgi |
PM |
Cytosol |
Nucleus |
|
| Expt A |
 5
5
peptides |
15
spectra |
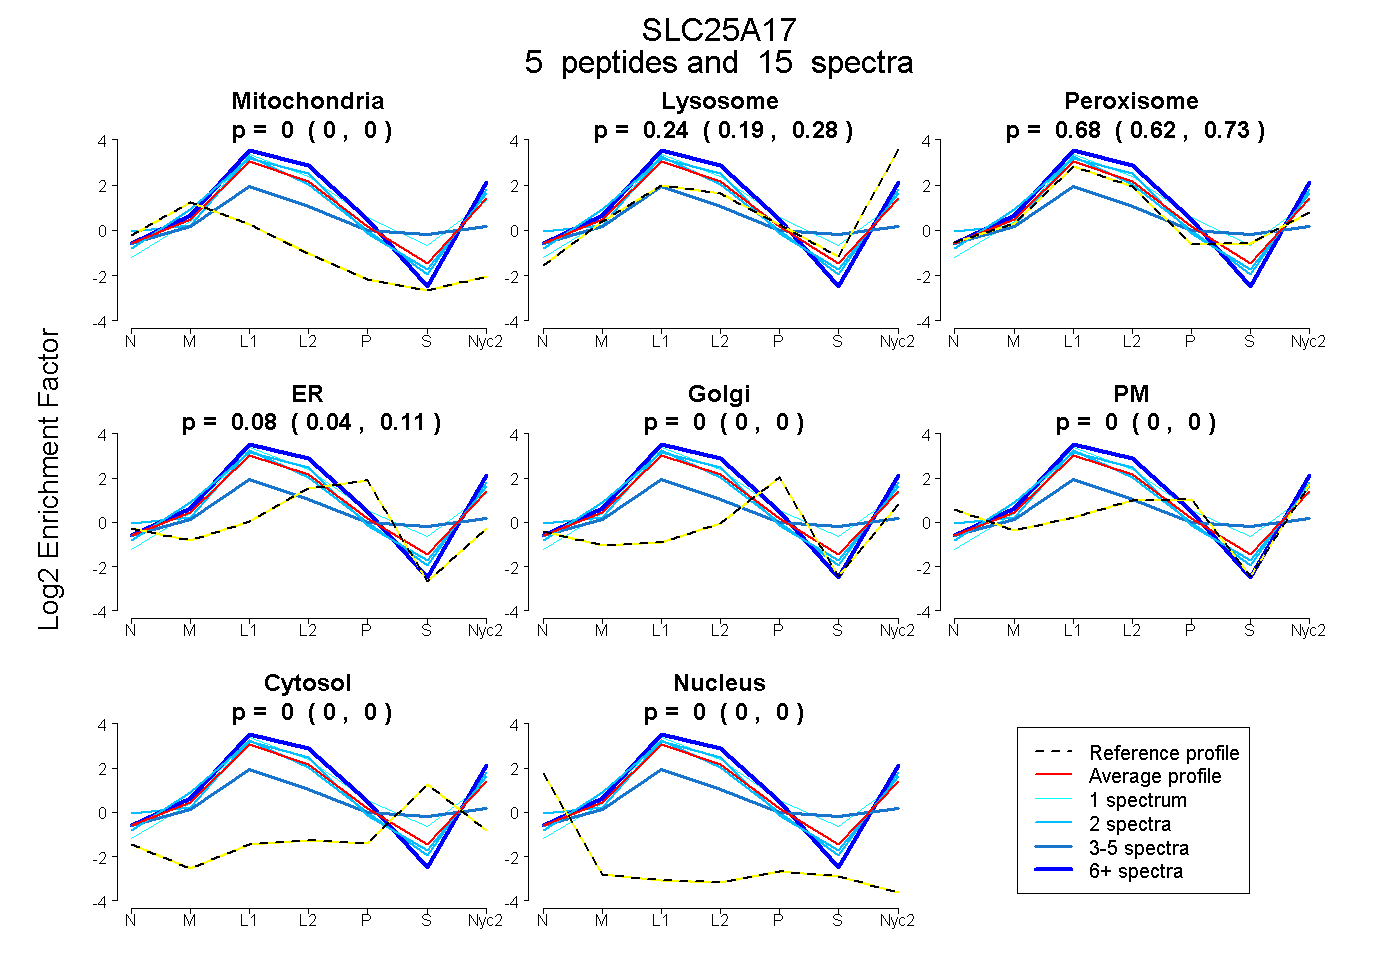 |
0.000
0.000 | 0.000 |
0.237
0.185 | 0.279 |
|
0.685
0.624 | 0.731 |
0.079
0.043 | 0.108 |
0.000
0.000 | 0.000 |
0.000
0.000 | 0.000 |
0.000
0.000 | 0.000 |
0.000
0.000 | 0.000 |
|
| | | Plot |
Mito |
|
Lyso or Perox |
|
ER |
Golgi |
PM |
Cytosol |
Nucleus |
|
| Expt B |
3
peptides |
6
spectra |
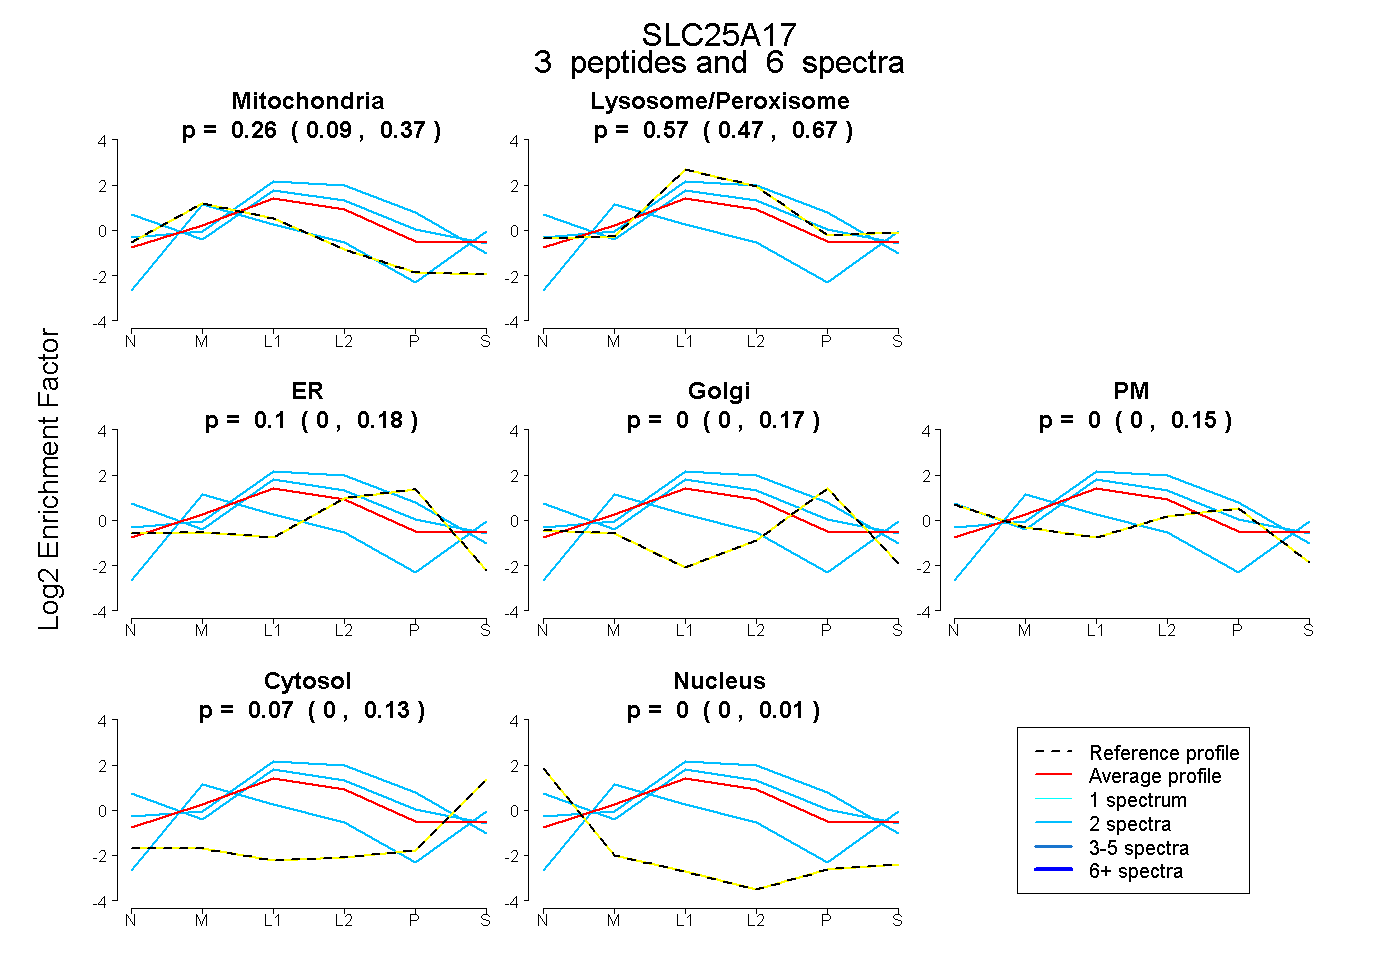 |
0.256
0.089 | 0.368 |
|
0.572
0.470 | 0.670 |
|
0.098
0.000 | 0.178 |
0.000
0.000 | 0.171 |
0.000
0.000 | 0.155 |
0.073
0.000 | 0.134 |
0.000
0.000 | 0.009 |
|
| | | Plot |
|
Lyso |
|
|
|
|
|
|
|
Other |
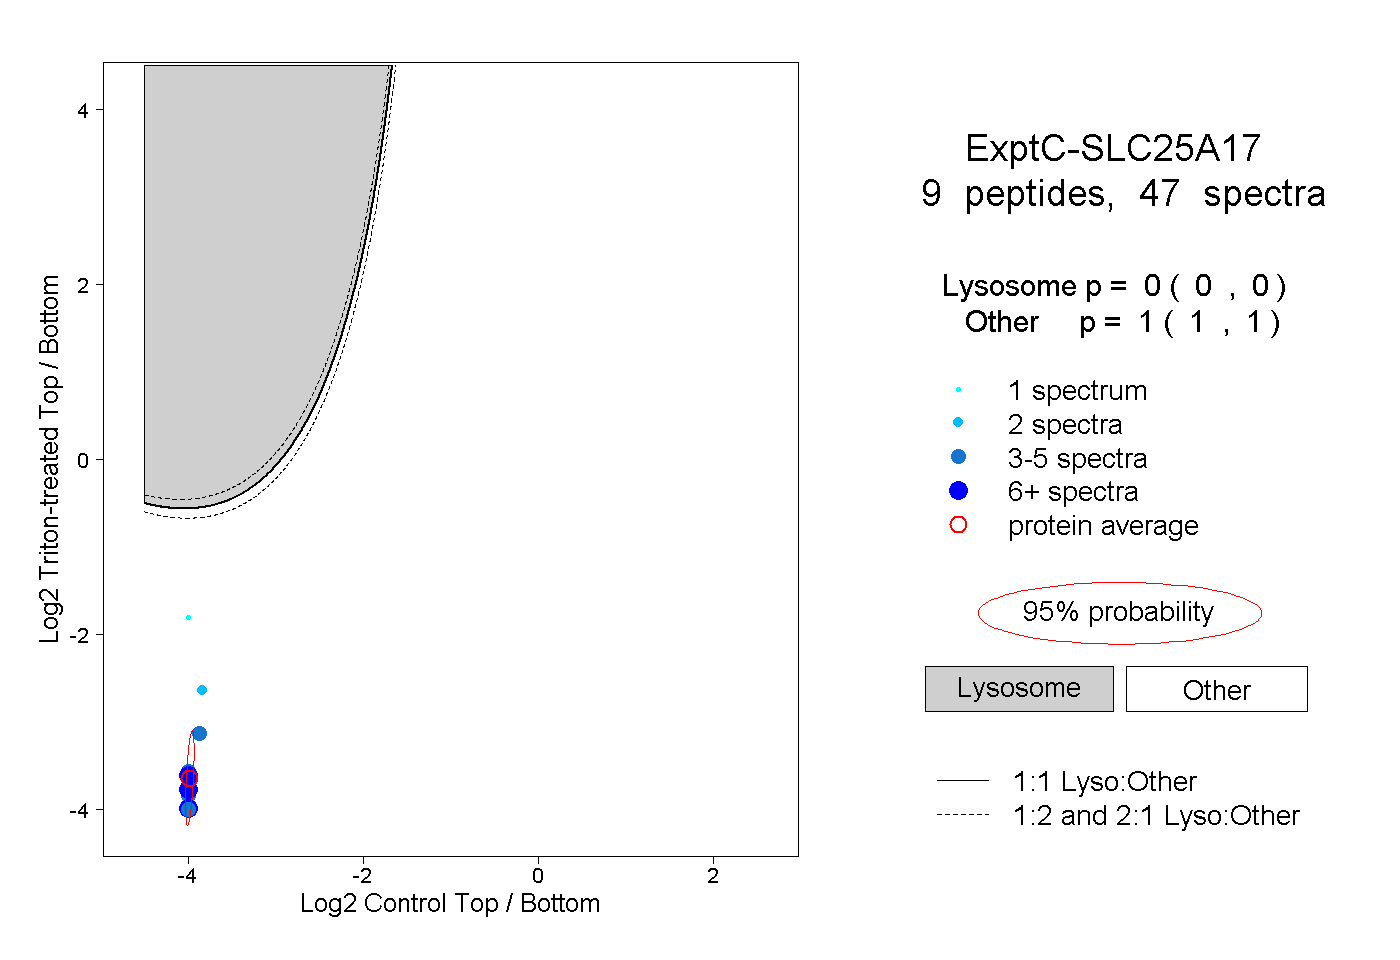
| Expt C |
9
peptides |
47
spectra |
 |
|
0.000
0.000 | 0.000 |
|
|
|
|
|
|
|
1.000
1.000 | 1.000 |
| 5 spectra, FGIMGLYK |
|
0.000 |
|
|
|
|
|
|
|
1.000 |
| 7 spectra, LQVDEK |
|
0.000 |
|
|
|
|
|
|
|
1.000 |
| 1 spectrum, LTAATFTVMGLK |
|
0.000 |
|
|
|
|
|
|
|
1.000 |
| 3 spectra, NVLSLLHQR |
|
0.000 |
|
|
|
|
|
|
|
1.000 |
| 12 spectra, GIIDAFHQIIR |
|
0.000 |
|
|
|
|
|
|
|
1.000 |
| 2 spectra, TTHAVLLEIIK |
|
0.000 |
|
|
|
|
|
|
|
1.000 |
| 7 spectra, LNPENR |
|
0.000 |
|
|
|
|
|
|
|
1.000 |
| 5 spectra, TLGSLR |
|
0.000 |
|
|
|
|
|
|
|
1.000 |
| 5 spectra, EEGLLAPYR |
|
0.000 |
|
|
|
|
|
|
|
1.000 |
| | | Plot |
|
Lyso |
|
|
|
|
|
|
|
Other |
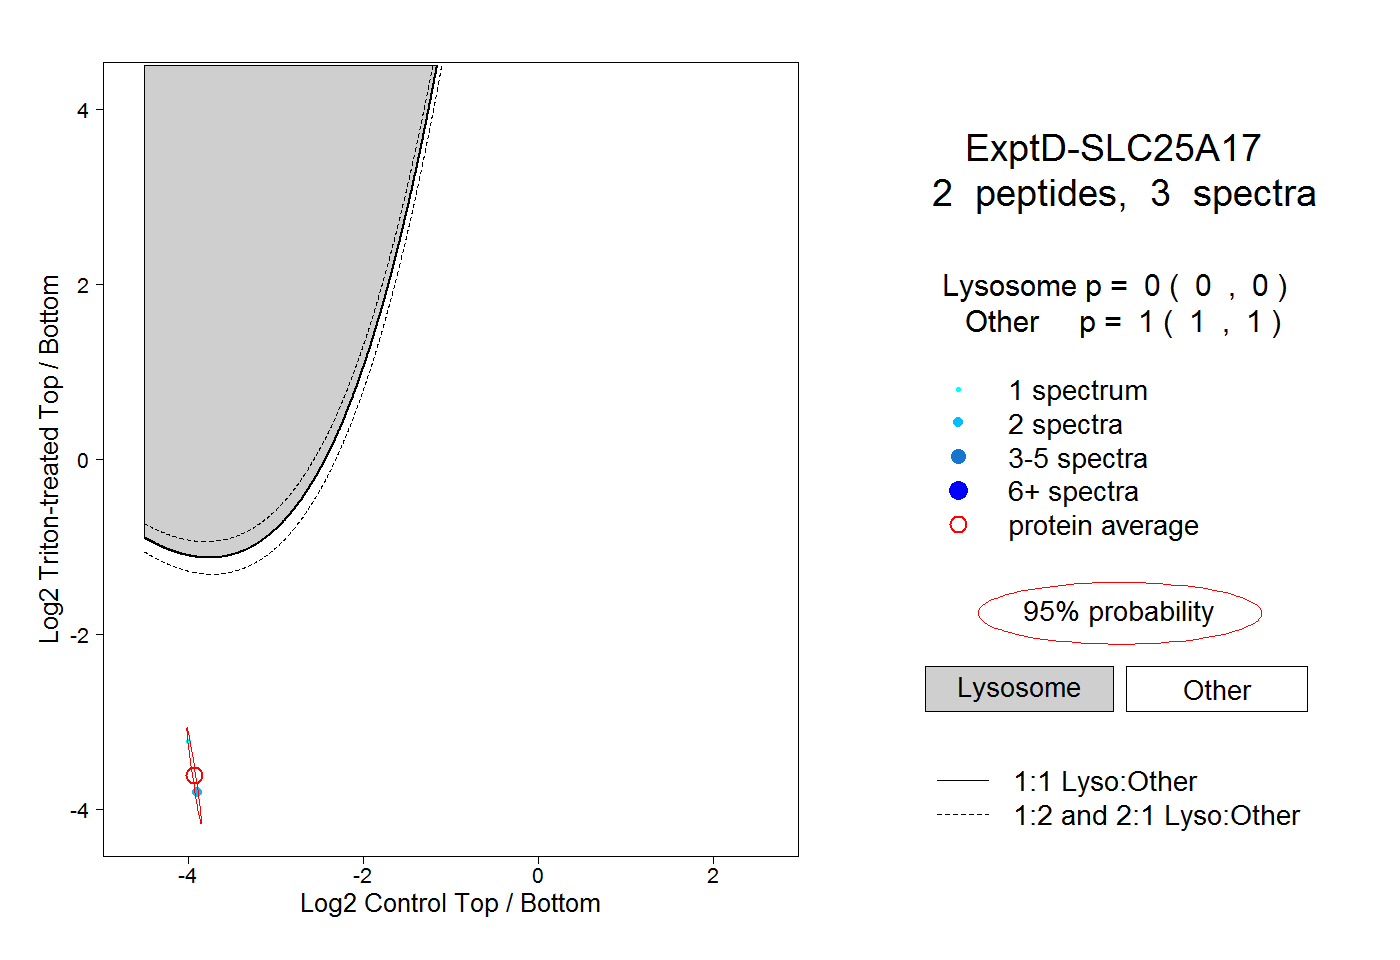
| Expt D |
2
peptides |
3
spectra |
 |
|
0.000
0.000 | 0.000 |
|
|
|
|
|
|
|
1.000
1.000 | 1.000 |