 7
7peptides
spectra
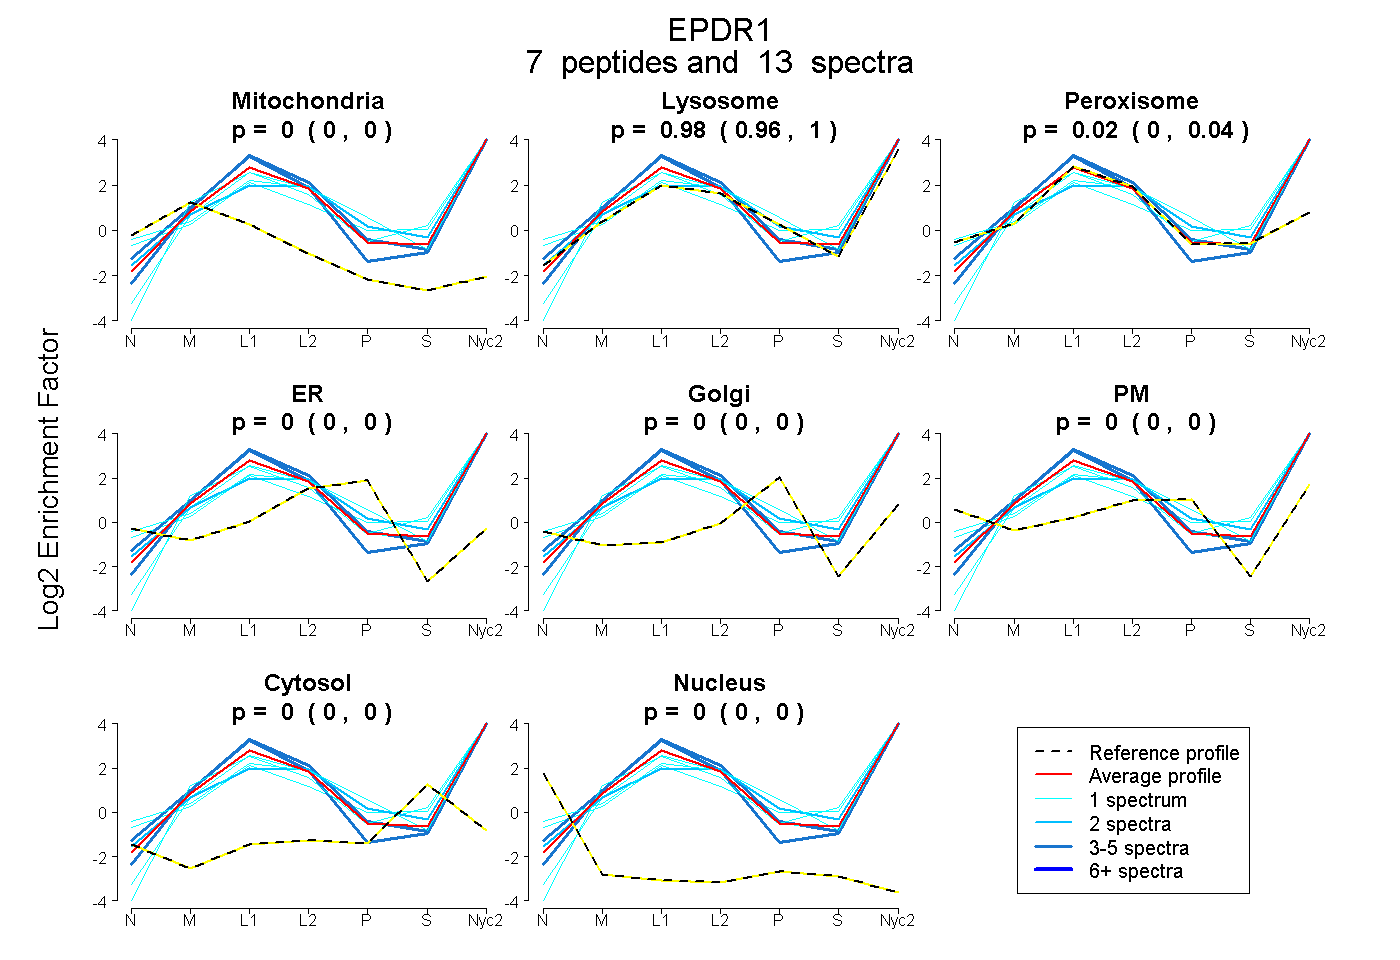
0.000 | 0.000
0.959 | 1.000
0.000 | 0.038
0.000 | 0.000
0.000 | 0.000
0.000 | 0.000
0.000 | 0.000
0.000 | 0.000
3peptides
spectra
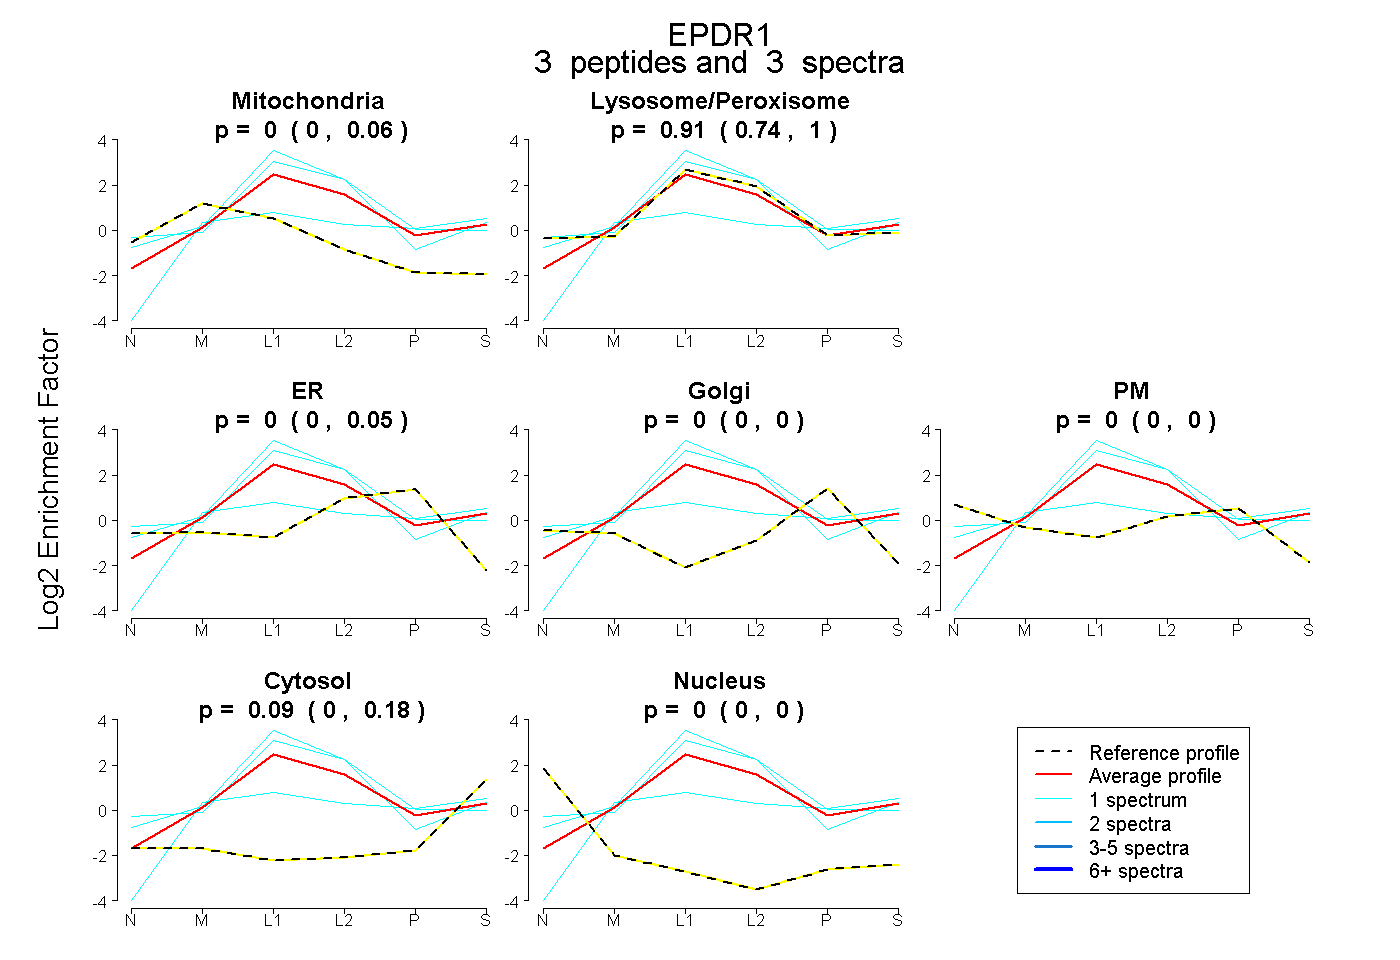
0.000 | 0.063
0.743 | 1.000
0.000 | 0.045
0.000 | 0.000
0.000 | 0.000
0.000 | 0.176
0.000 | 0.000
4peptides
spectra

0.570 | 1.000
0.000 | 0.397
2peptides
spectra
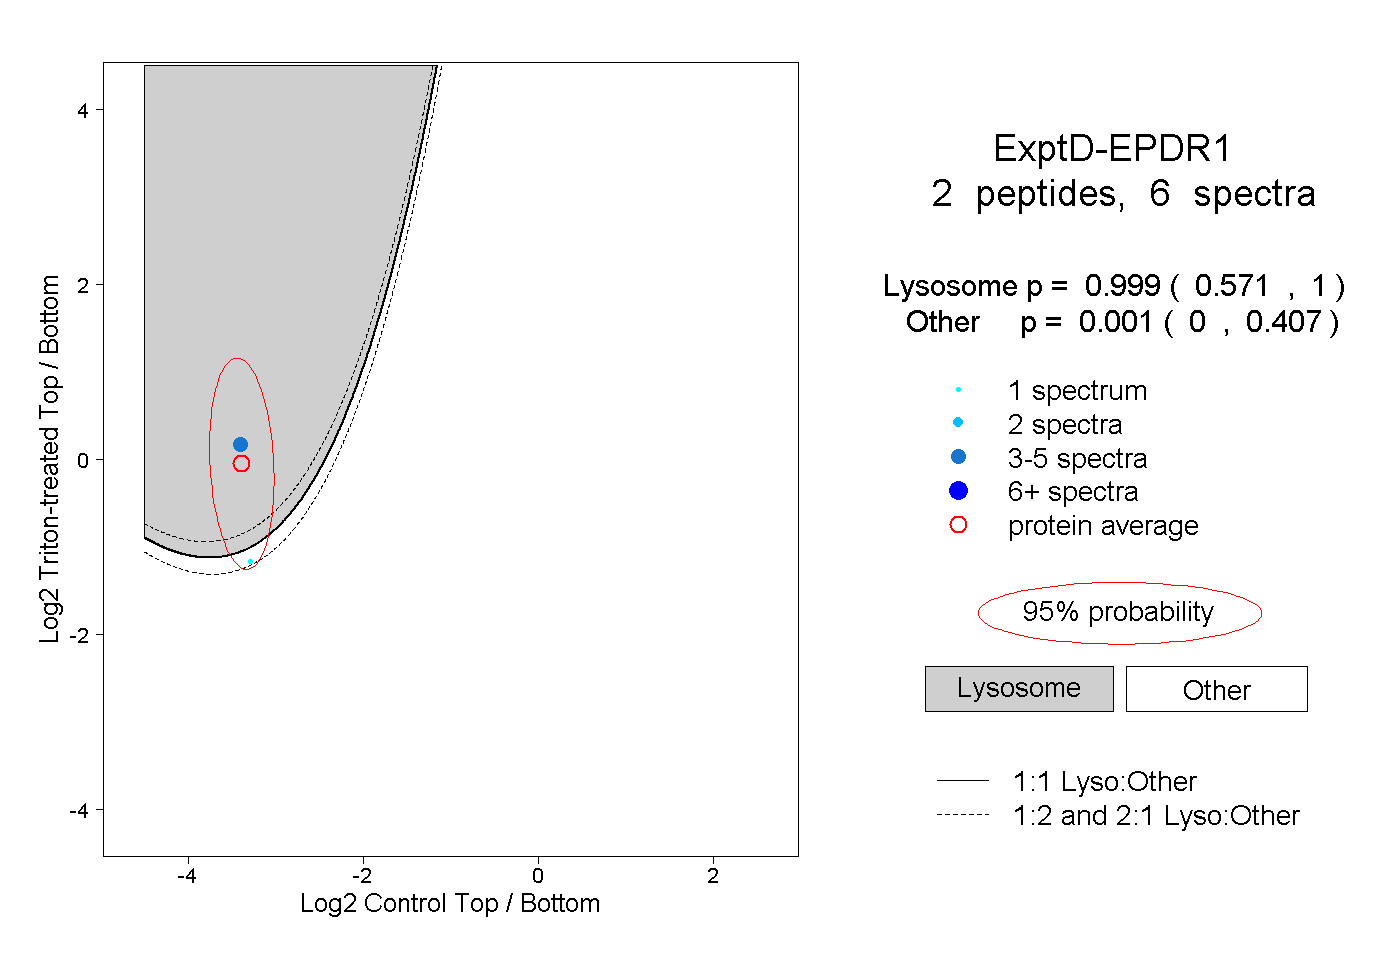
0.571 | 1.000
0.000 | 0.407