EPDR1
[ENSRNOP00000025674]
Main page
| | | Plot |
Mito |
Lyso |
|
Perox |
ER |
Golgi |
PM |
Cytosol |
Nucleus |
|
| Expt A |
 7
7
peptides |
13
spectra |
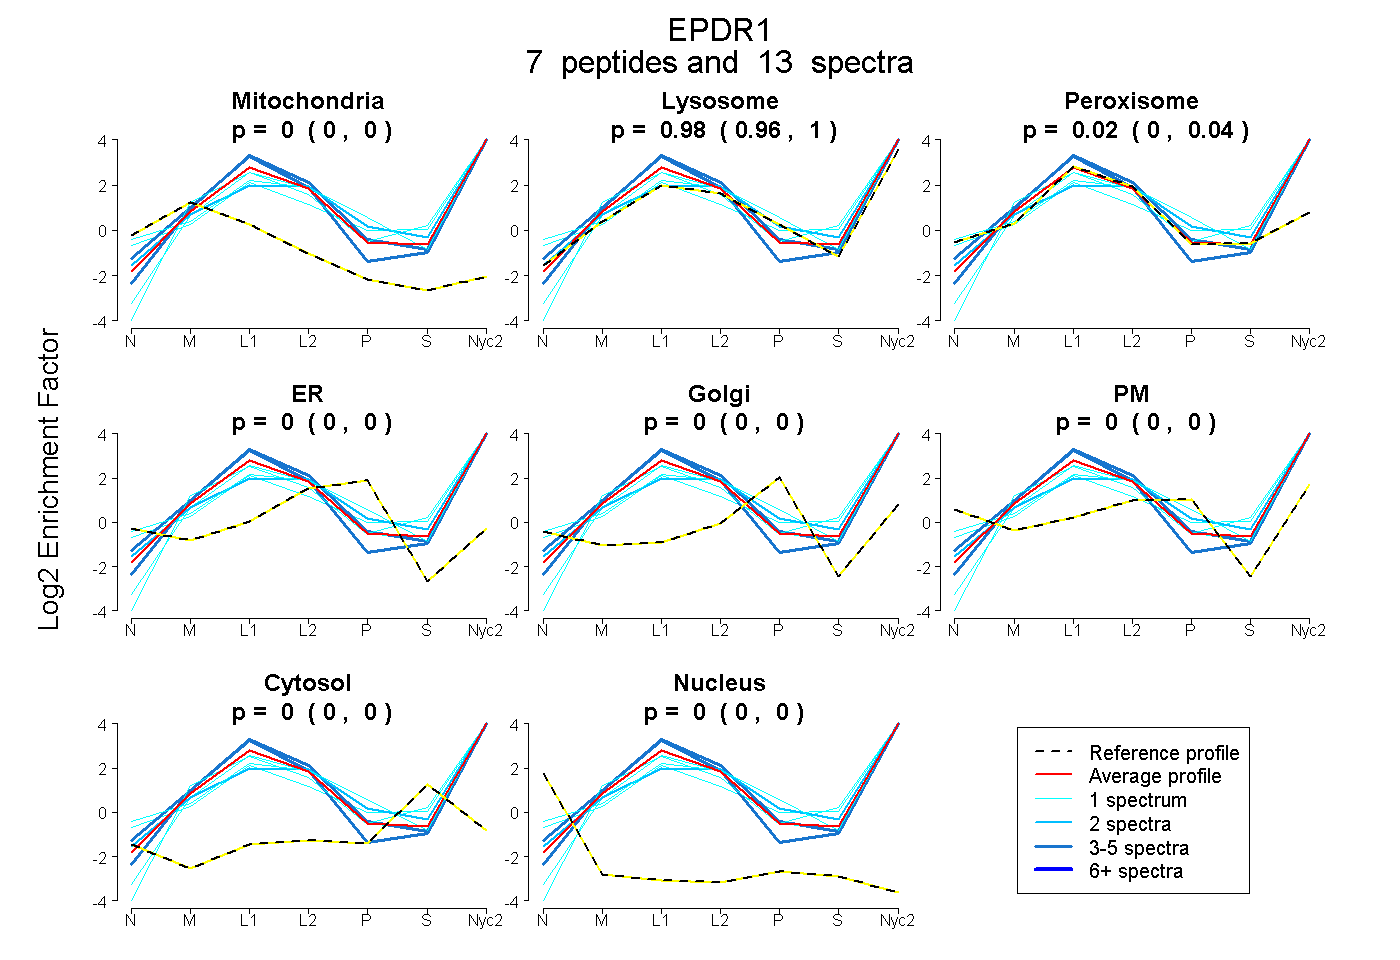 |
0.000
0.000 | 0.000 |
0.982
0.959 | 1.000 |
|
0.018
0.000 | 0.038 |
0.000
0.000 | 0.000 |
0.000
0.000 | 0.000 |
0.000
0.000 | 0.000 |
0.000
0.000 | 0.000 |
0.000
0.000 | 0.000 |
|
| | | Plot |
Mito |
|
Lyso or Perox |
|
ER |
Golgi |
PM |
Cytosol |
Nucleus |
|
| Expt B |
3
peptides |
3
spectra |
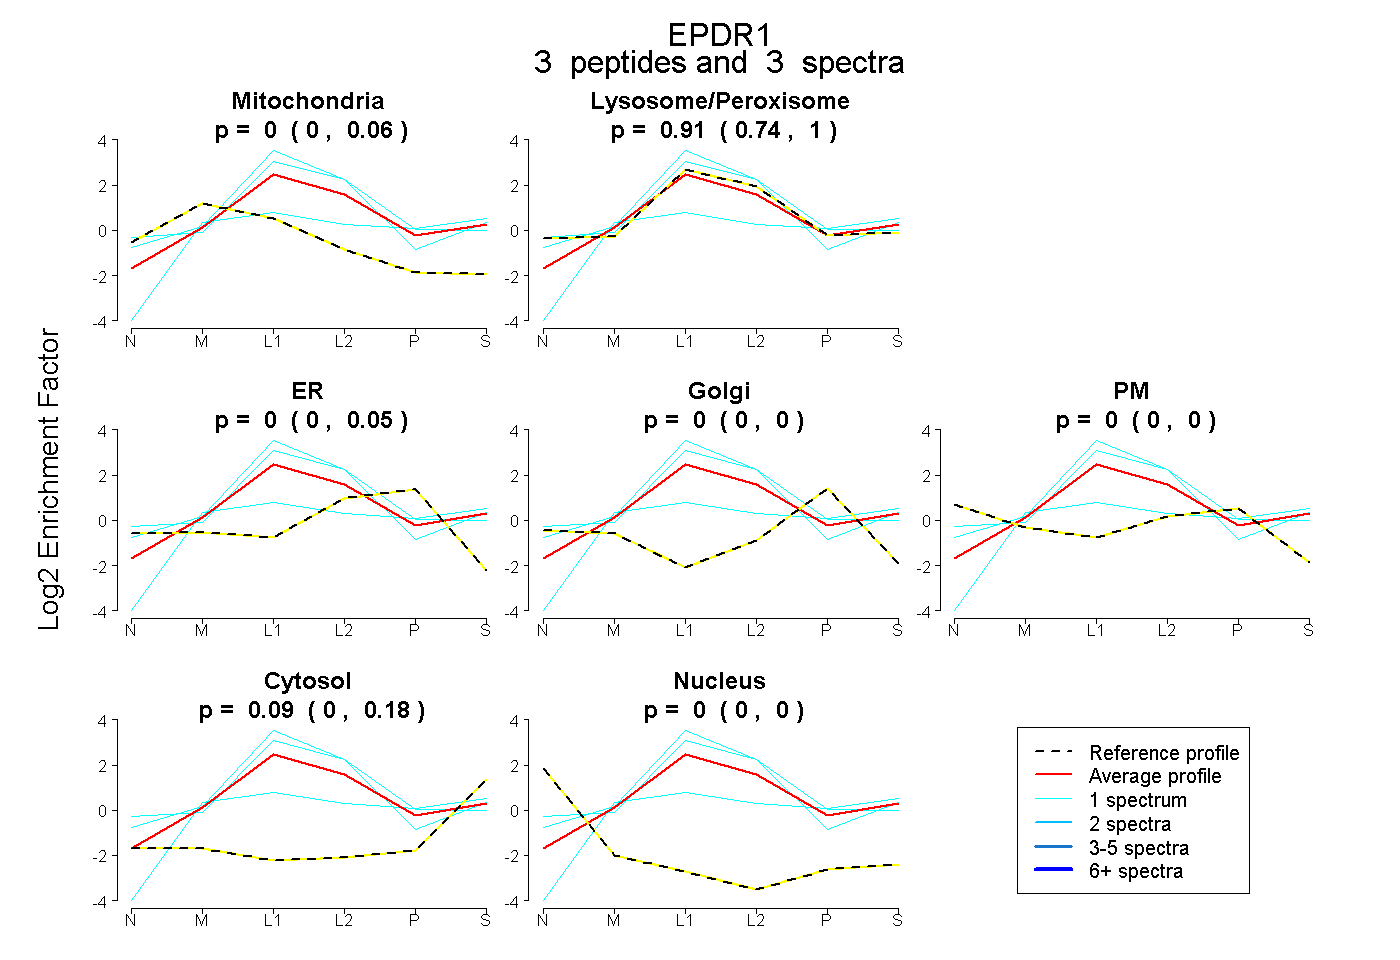 |
0.000
0.000 | 0.063 |
|
0.909
0.743 | 1.000 |
|
0.000
0.000 | 0.045 |
0.000
0.000 | 0.000 |
0.000
0.000 | 0.000 |
0.091
0.000 | 0.176 |
0.000
0.000 | 0.000 |
|
| | | Plot |
|
Lyso |
|
|
|
|
|
|
|
Other |
| Expt C |
4
peptides |
14
spectra |
 |
|
1.000
0.570 | 1.000 |
|
|
|
|
|
|
|
0.000
0.000 | 0.397 |
| 5 spectra, ALVSYDGLNQR |
|
1.000 |
|
|
|
|
|
|
|
0.000 |
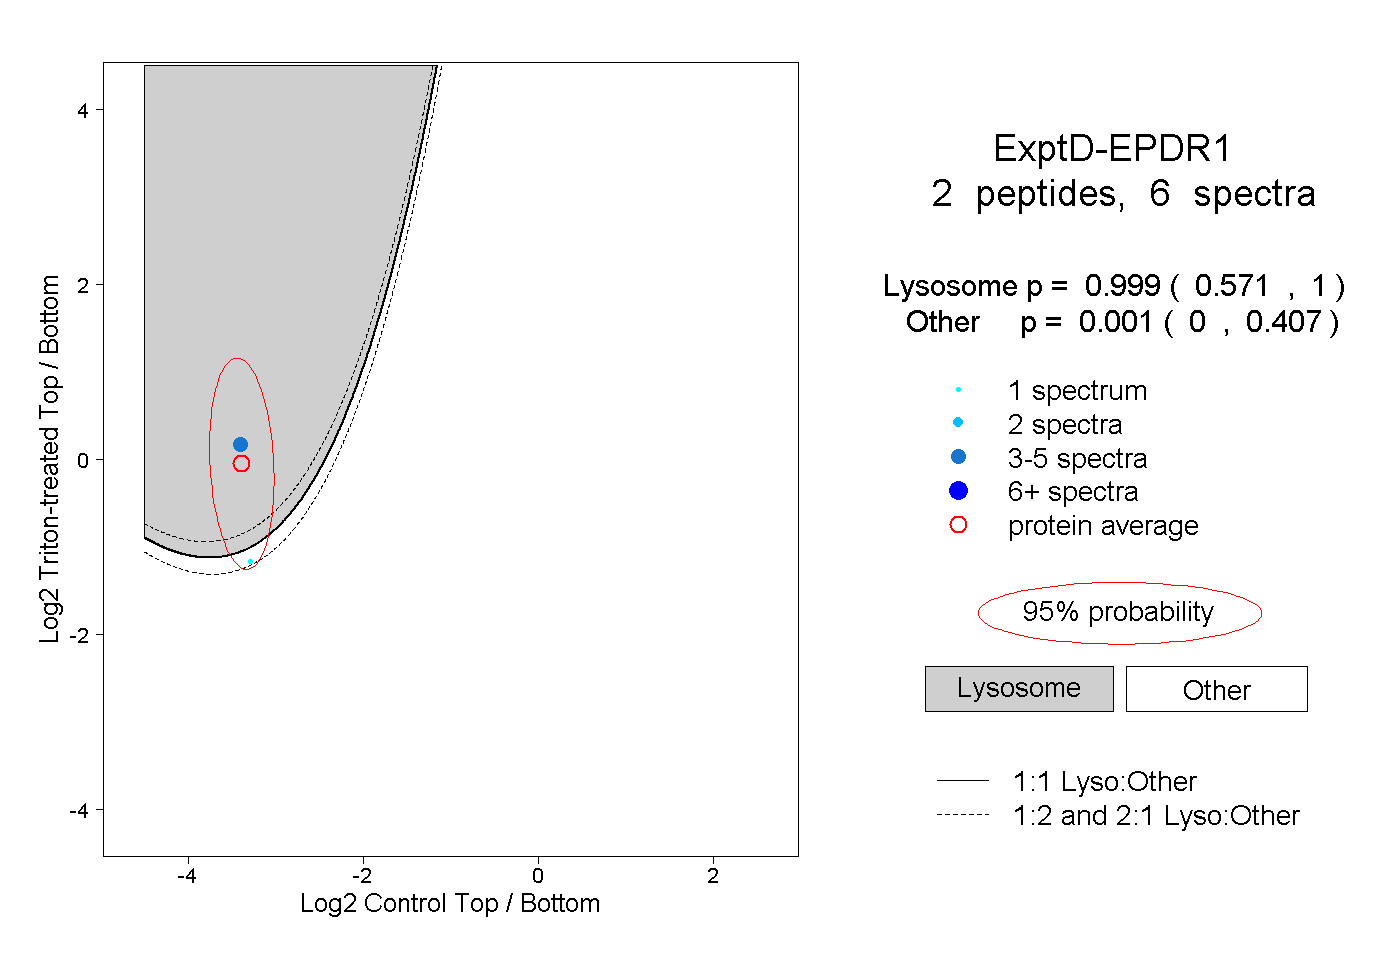
| 2 spectra, QVLYQQSSGHNSR |
|
0.000 |
|
|
|
|
|
|
|
1.000 |
| 3 spectra, ALIPCK |
|
1.000 |
|
|
|
|
|
|
|
0.000 |
| 4 spectra, DCYPVQETFIR |
|
1.000 |
|
|
|
|
|
|
|
0.000 |
| | | Plot |
|
Lyso |
|
|
|
|
|
|
|
Other |
| Expt D |
2
peptides |
6
spectra |
 |
|
0.999
0.571 | 1.000 |
|
|
|
|
|
|
|
0.001
0.000 | 0.407 |