 10
10peptides
spectra
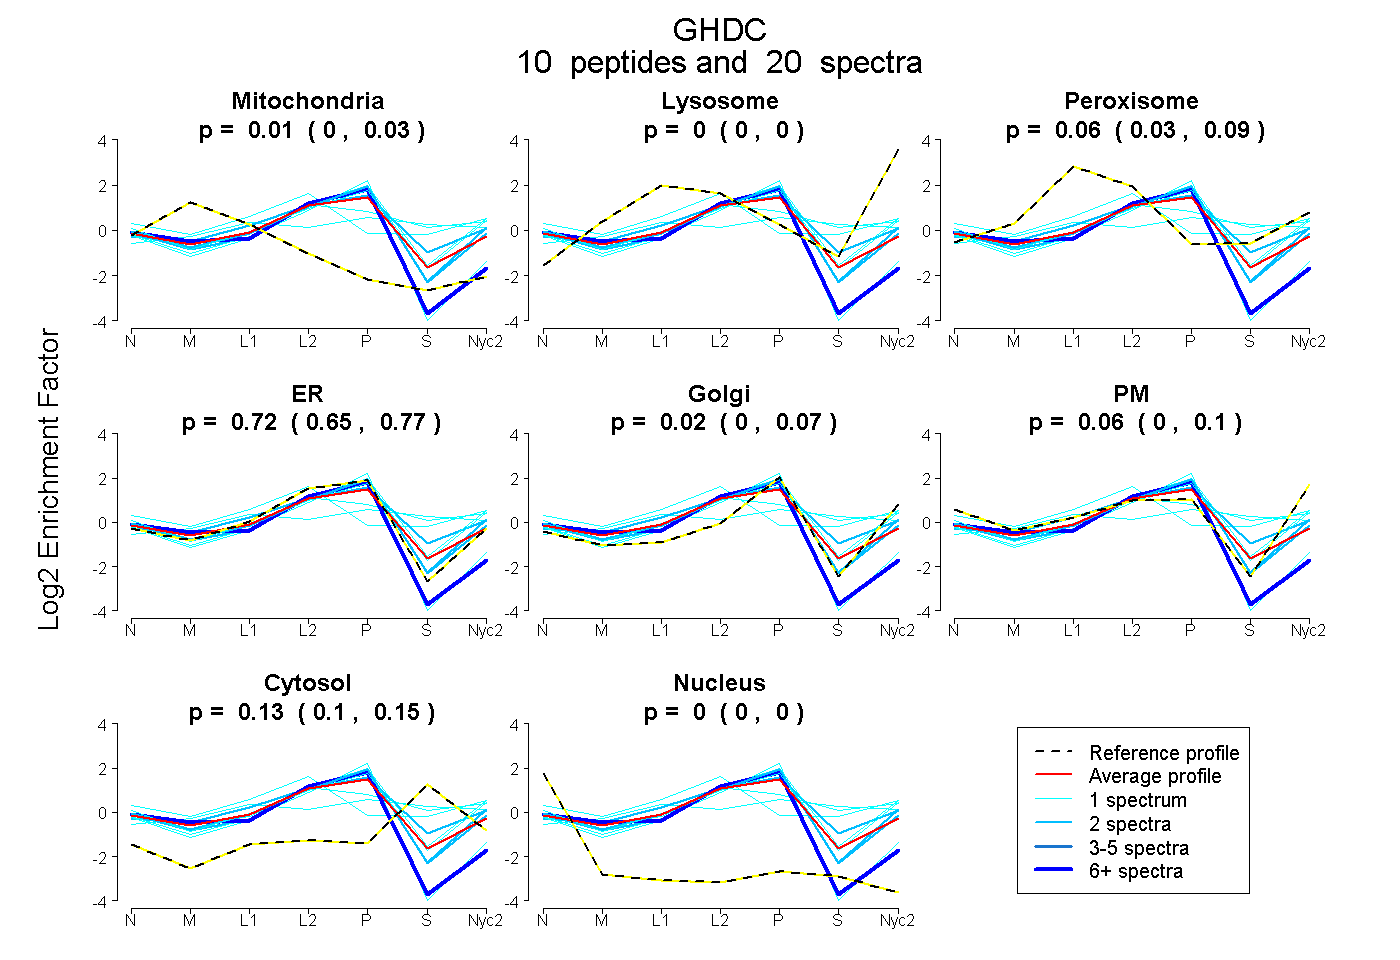
0.000 | 0.031
0.000 | 0.000
0.034 | 0.086
0.652 | 0.767
0.000 | 0.074
0.003 | 0.100
0.102 | 0.153
0.000 | 0.000
2peptides
spectra
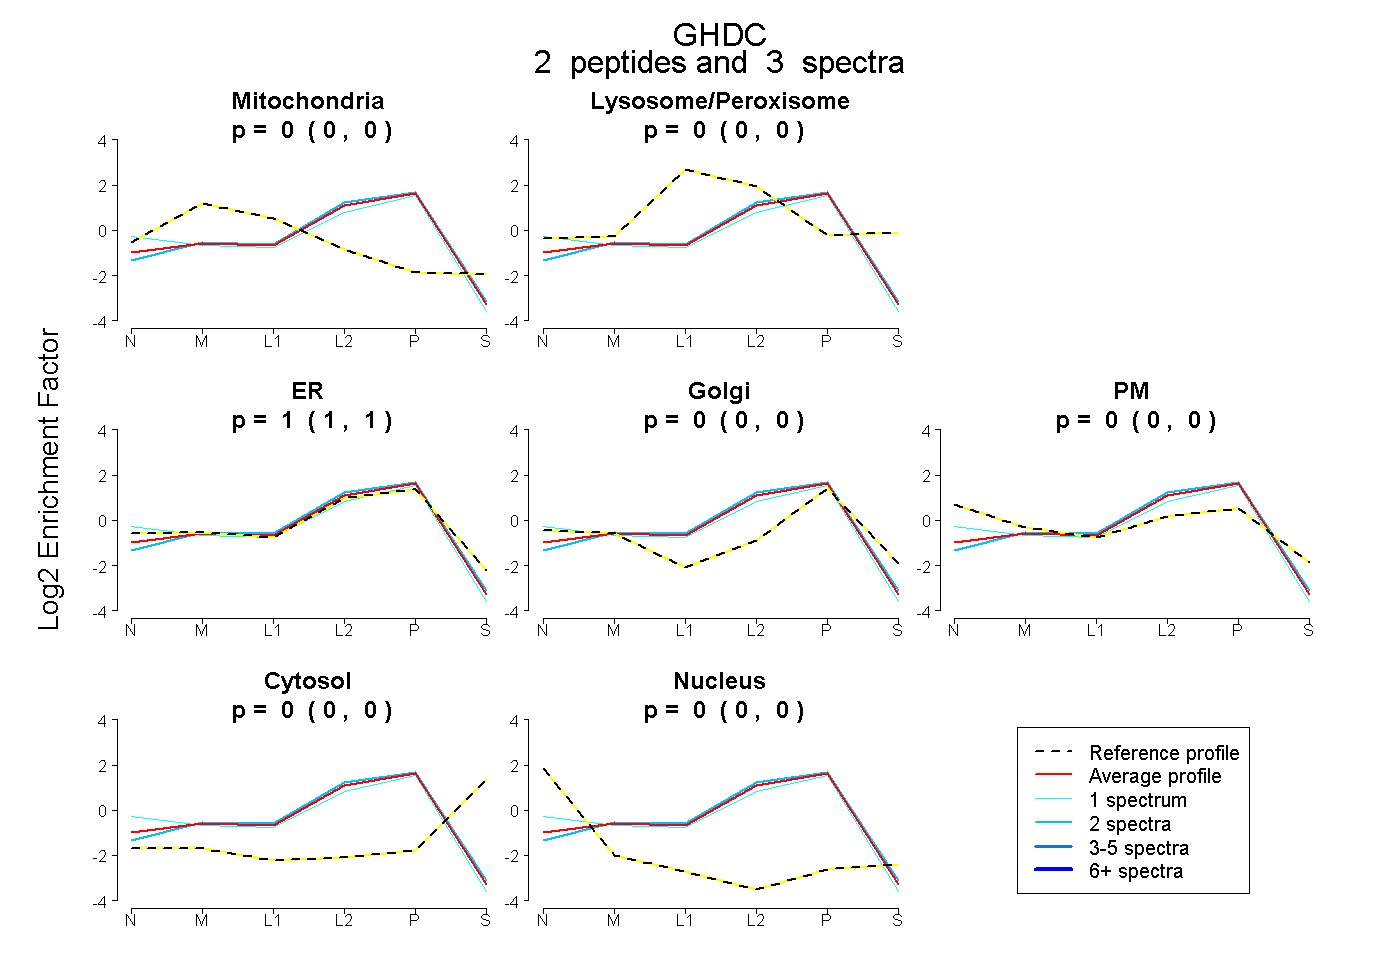
0.000 | 0.000
0.000 | 0.000
1.000 | 1.000
0.000 | 0.000
0.000 | 0.000
0.000 | 0.000
0.000 | 0.000
6peptides
spectra
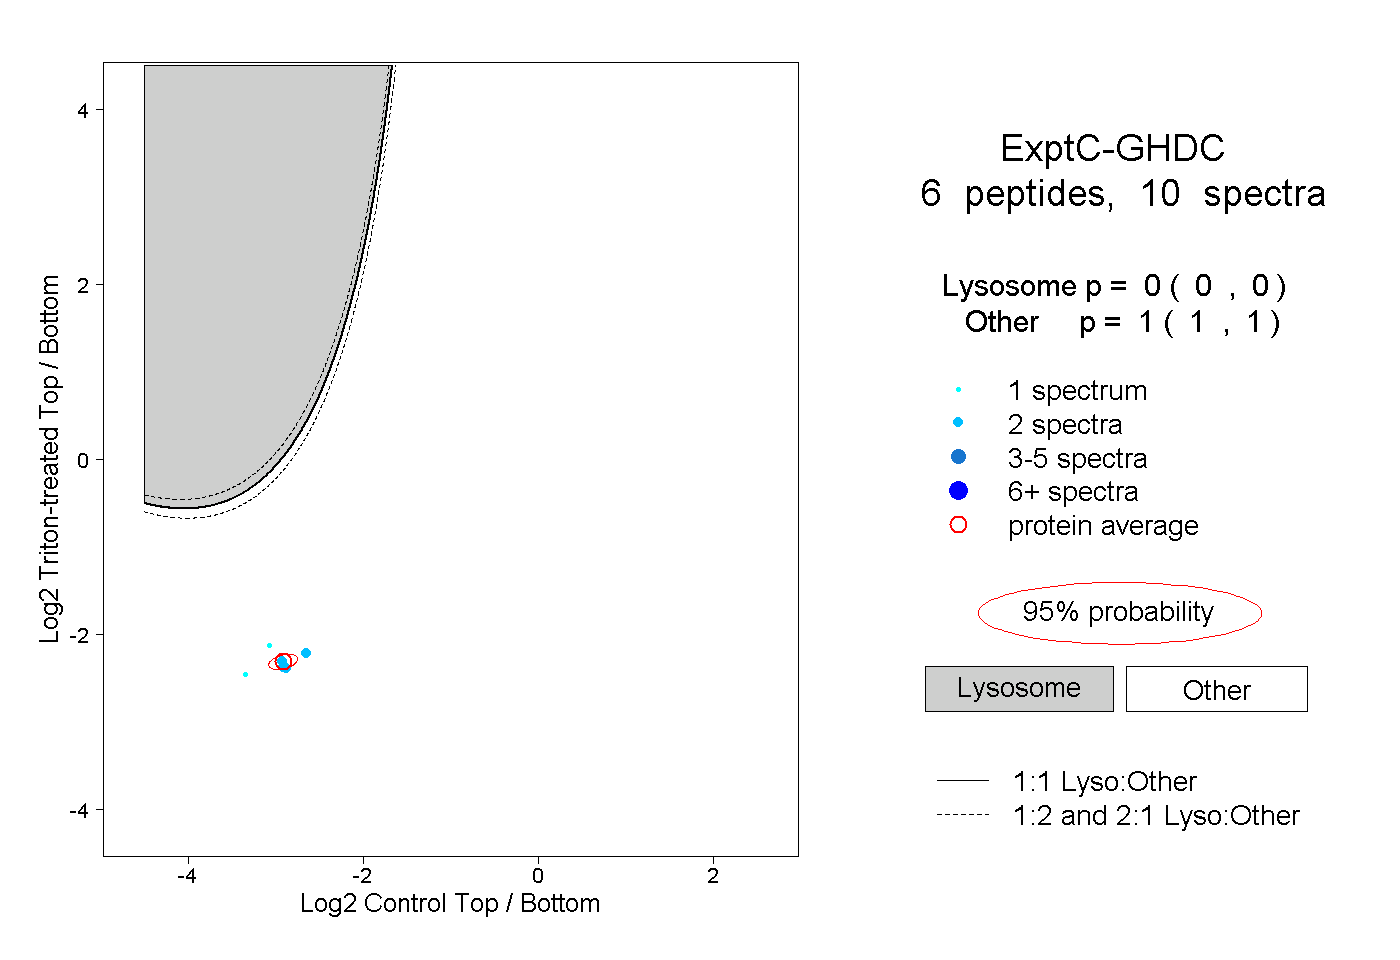
0.000 | 0.000
1.000 | 1.000