 10
10peptides
spectra
0.000 | 0.031
0.000 | 0.000
0.034 | 0.086
0.652 | 0.767
0.000 | 0.074
0.003 | 0.100
0.102 | 0.153
0.000 | 0.000
| Plot | Mito | Lyso | Perox | ER | Golgi | PM | Cytosol | Nucleus | |||||
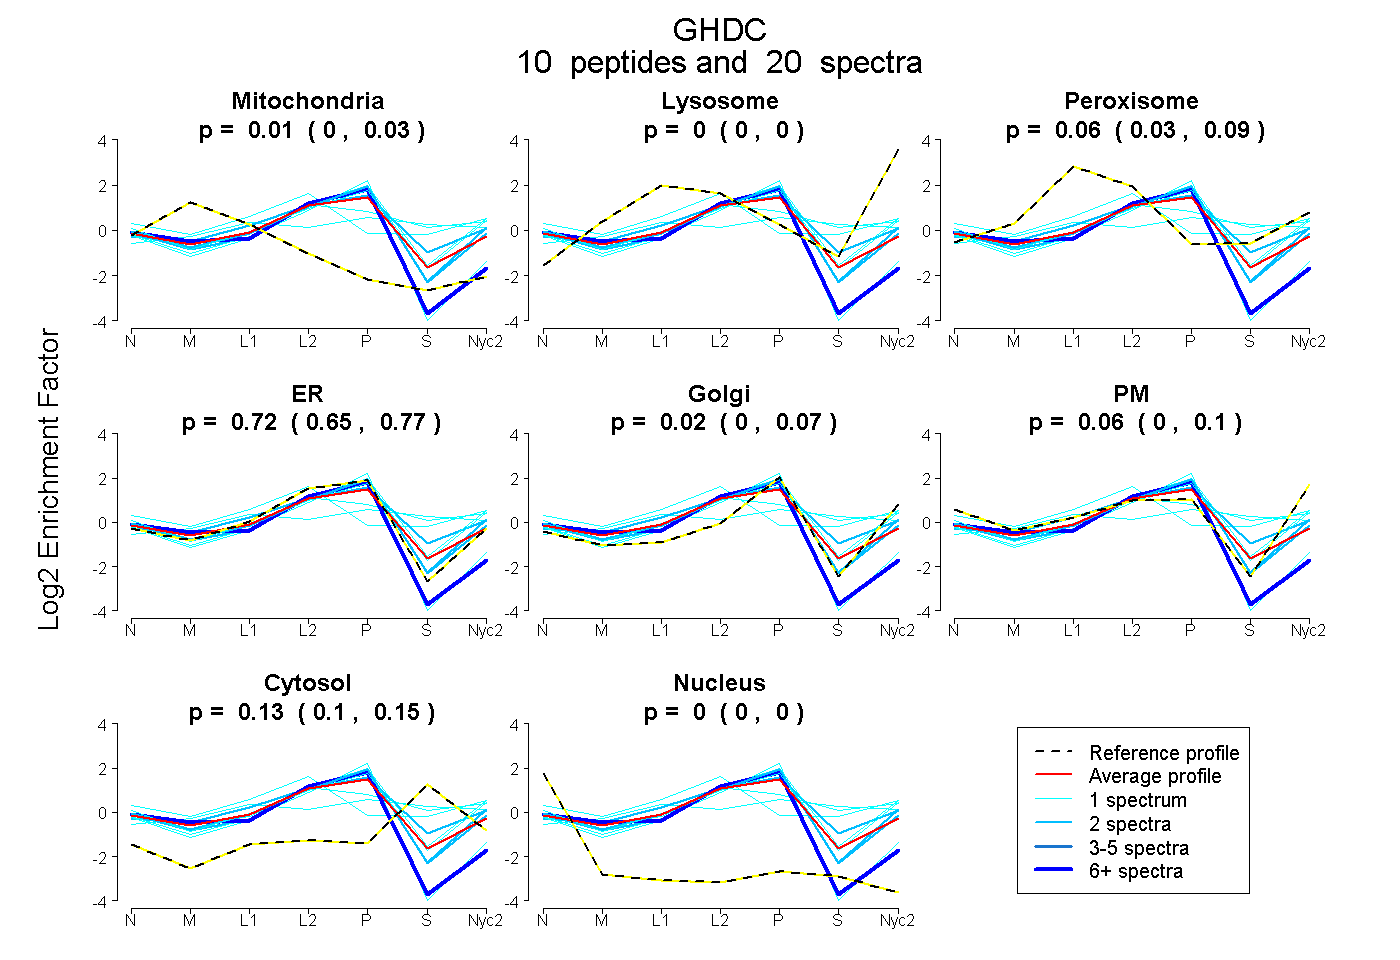
| Expt A |
10 peptides |
20 spectra |
|
0.009 0.000 | 0.031 |
0.000 0.000 | 0.000 |
0.061 0.034 | 0.086 |
0.722 0.652 | 0.767 |
0.019 0.000 | 0.074 |
0.059 0.003 | 0.100 |
0.132 0.102 | 0.153 |
0.000 0.000 | 0.000 |
| 8 spectra, VHLVRPGSFR | 0.054 | 0.000 | 0.000 | 0.854 | 0.000 | 0.000 | 0.000 | 0.091 | ||
| 1 spectrum, LGQTLSVR | 0.000 | 0.074 | 0.000 | 0.506 | 0.301 | 0.032 | 0.087 | 0.000 | ||
| 2 spectra, HLAQLLQK | 0.000 | 0.000 | 0.000 | 0.640 | 0.245 | 0.088 | 0.028 | 0.000 | ||
| 2 spectra, FWGSVGPAK | 0.000 | 0.000 | 0.236 | 0.436 | 0.219 | 0.000 | 0.109 | 0.000 | ||
| 1 spectrum, TSHTQQK | 0.000 | 0.000 | 0.000 | 0.897 | 0.000 | 0.000 | 0.000 | 0.103 | ||
| 1 spectrum, EAQGSCCLPR | 0.000 | 0.090 | 0.162 | 0.302 | 0.000 | 0.130 | 0.316 | 0.000 | ||
| 1 spectrum, AAELQEALEQGPR | 0.000 | 0.000 | 0.398 | 0.000 | 0.288 | 0.000 | 0.314 | 0.000 | ||
| 1 spectrum, EALAACPSSSCPEMPR | 0.000 | 0.000 | 0.473 | 0.020 | 0.000 | 0.302 | 0.205 | 0.000 | ||
| 1 spectrum, YELVLTDSTSLTR | 0.000 | 0.000 | 0.053 | 0.434 | 0.223 | 0.220 | 0.070 | 0.000 | ||
| 2 spectra, VSPIGAK | 0.000 | 0.000 | 0.024 | 0.717 | 0.213 | 0.018 | 0.013 | 0.015 |
| Plot | Mito | Lyso or Perox | ER | Golgi | PM | Cytosol | Nucleus | ||||||
| Expt B |
2 peptides |
3 spectra |
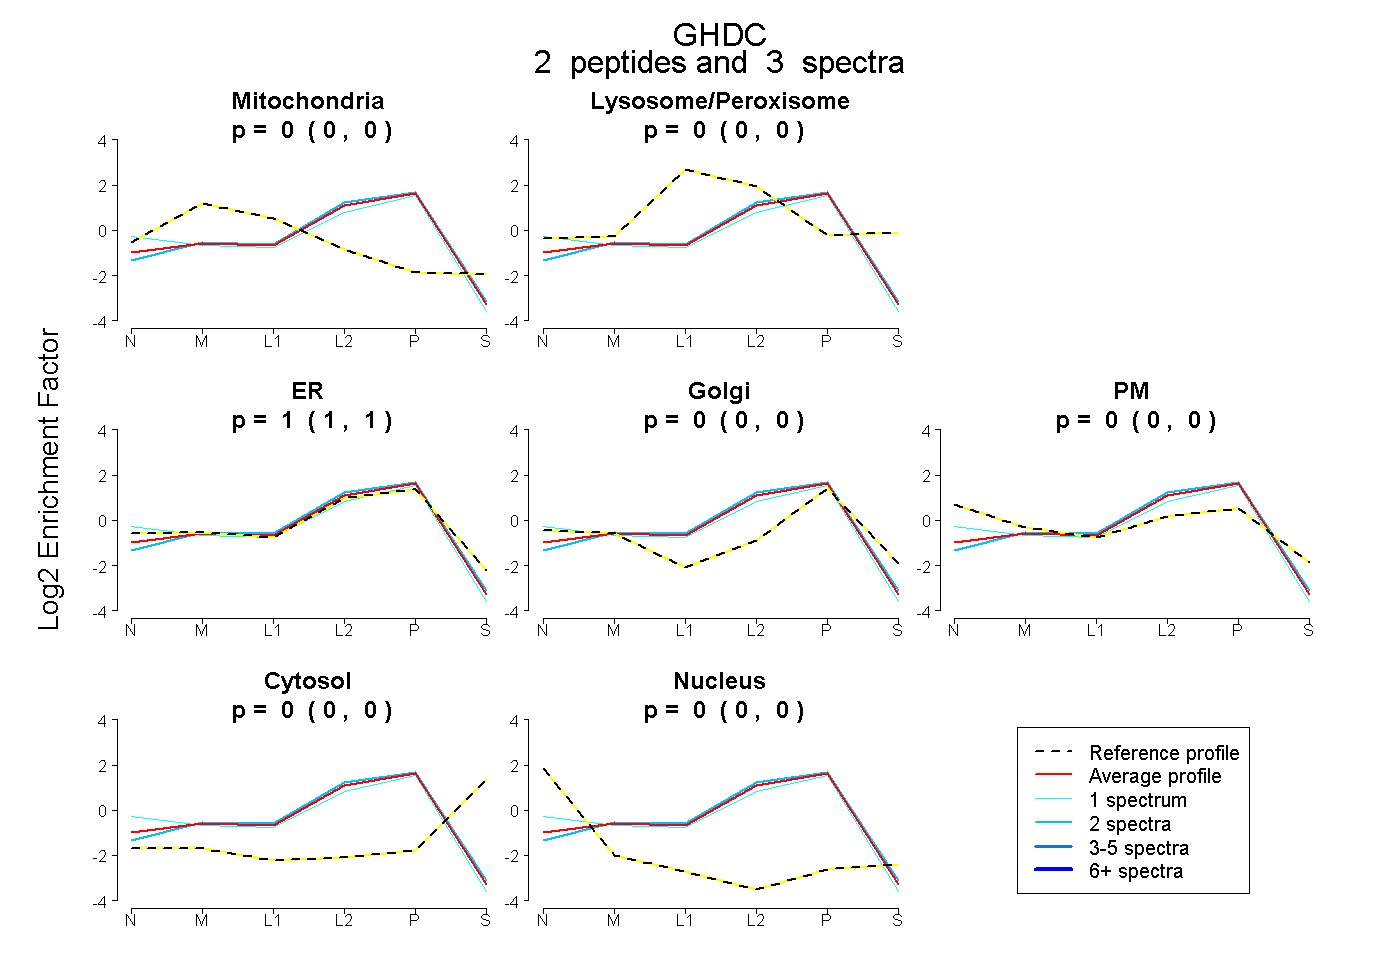 |
0.000 0.000 | 0.000 |
0.000 0.000 | 0.000 |
1.000 1.000 | 1.000 |
0.000 0.000 | 0.000 |
0.000 0.000 | 0.000 |
0.000 0.000 | 0.000 |
0.000 0.000 | 0.000 |
|||
| Plot | Lyso | Other | |||||||||||
| Expt C |
6 peptides |
10 spectra |
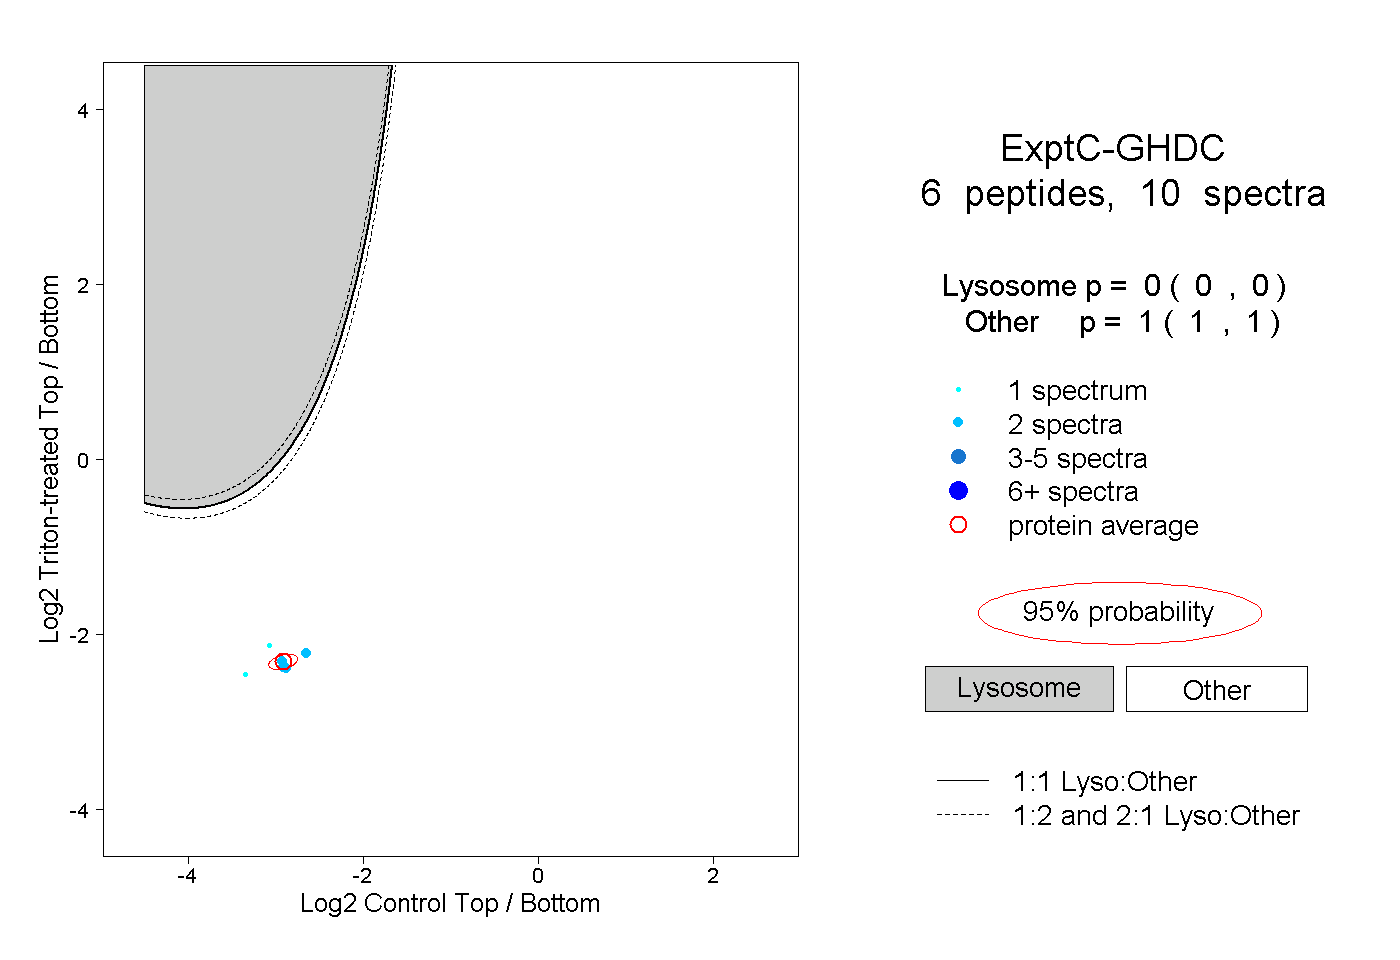 |
0.000 0.000 | 0.000 |
1.000 1.000 | 1.000 |