 3
3peptides
spectra
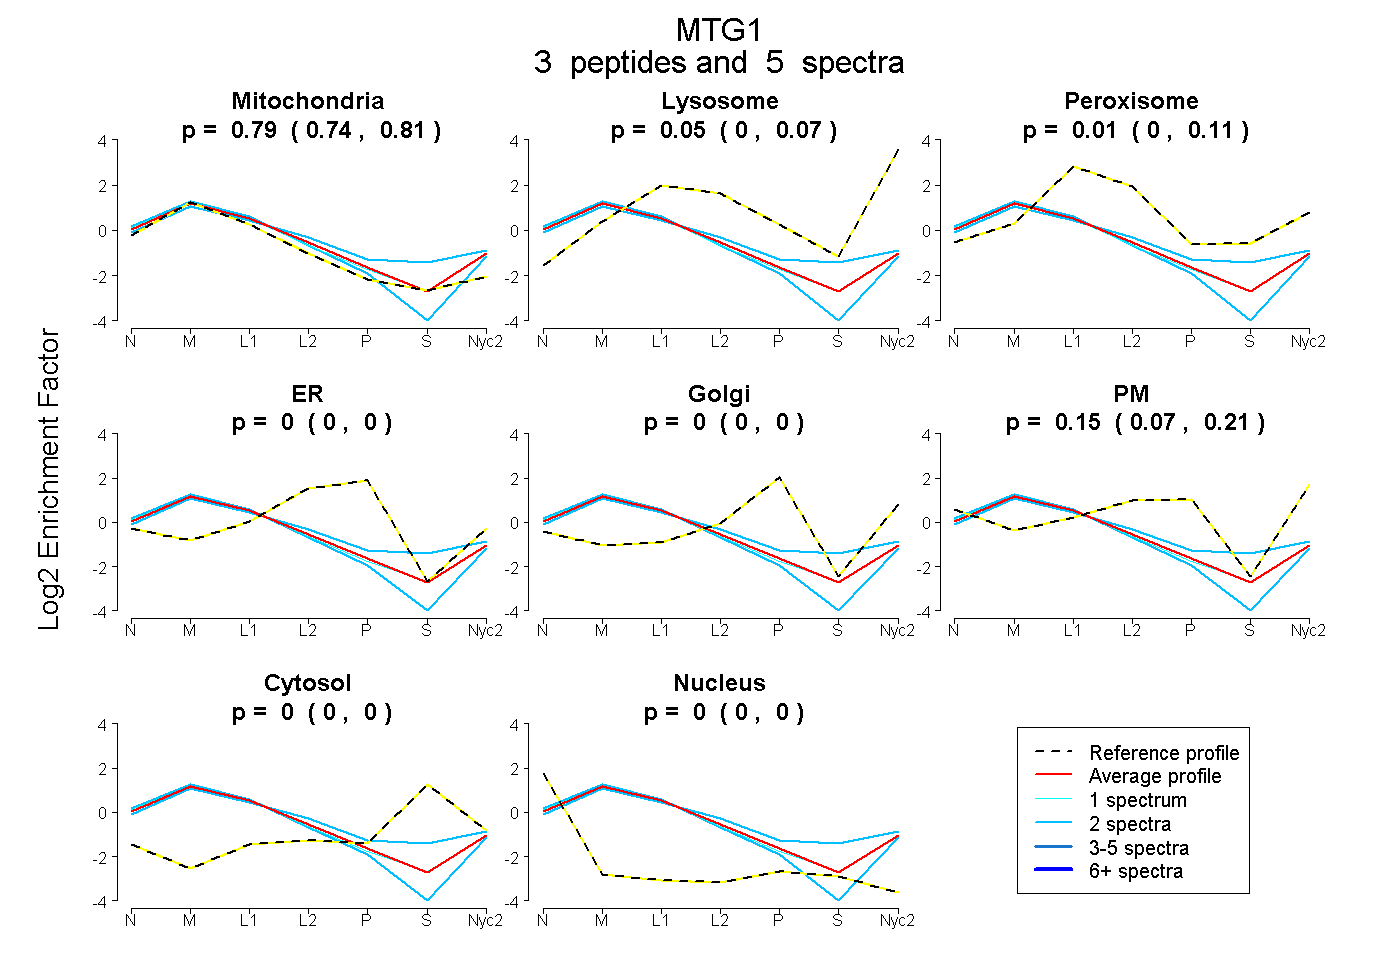
0.739 | 0.806
0.000 | 0.065
0.000 | 0.108
0.000 | 0.000
0.000 | 0.000
0.073 | 0.207
0.000 | 0.003
0.000 | 0.000
9peptides
spectra
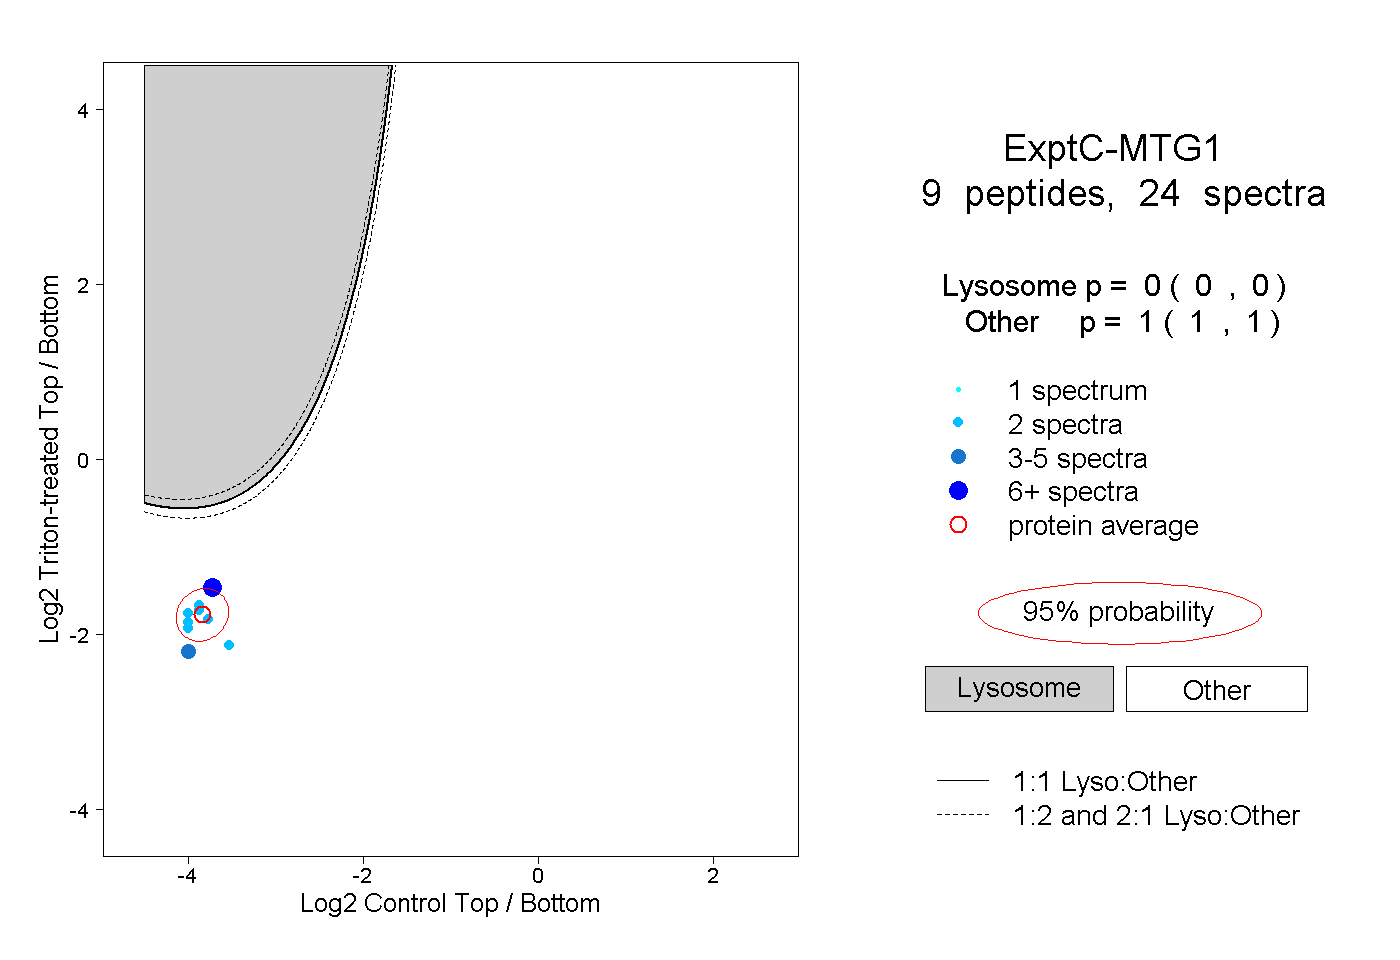
0.000 | 0.000
1.000 | 1.000
2peptides
spectra
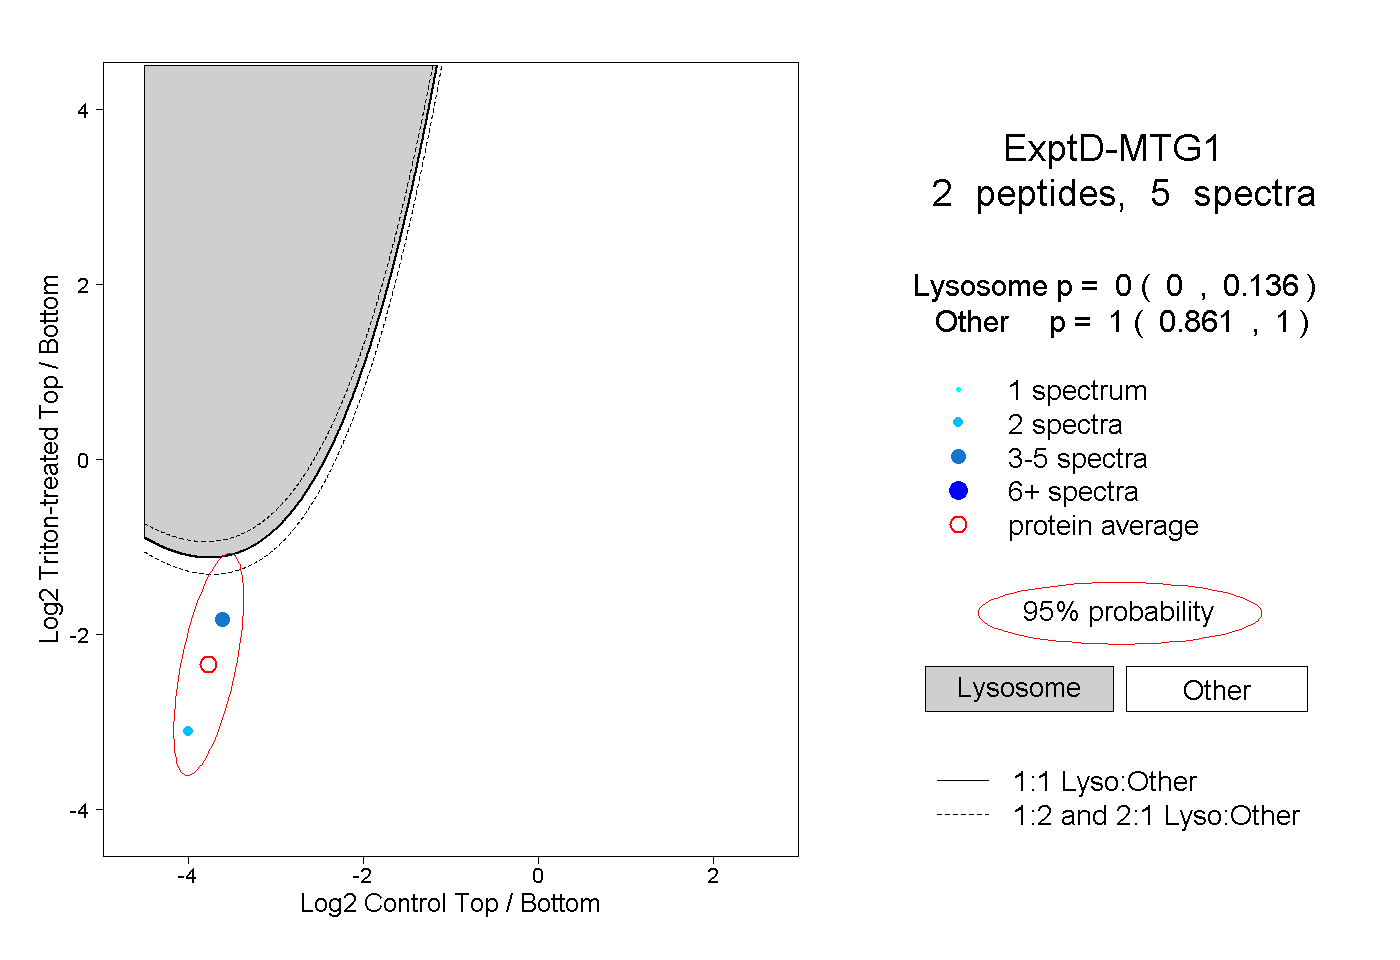
0.000 | 0.136
0.861 | 1.000