 3
3peptides
spectra
0.739 | 0.806
0.000 | 0.065
0.000 | 0.108
0.000 | 0.000
0.000 | 0.000
0.073 | 0.207
0.000 | 0.003
0.000 | 0.000
9peptides
spectra
0.000 | 0.000
1.000 | 1.000
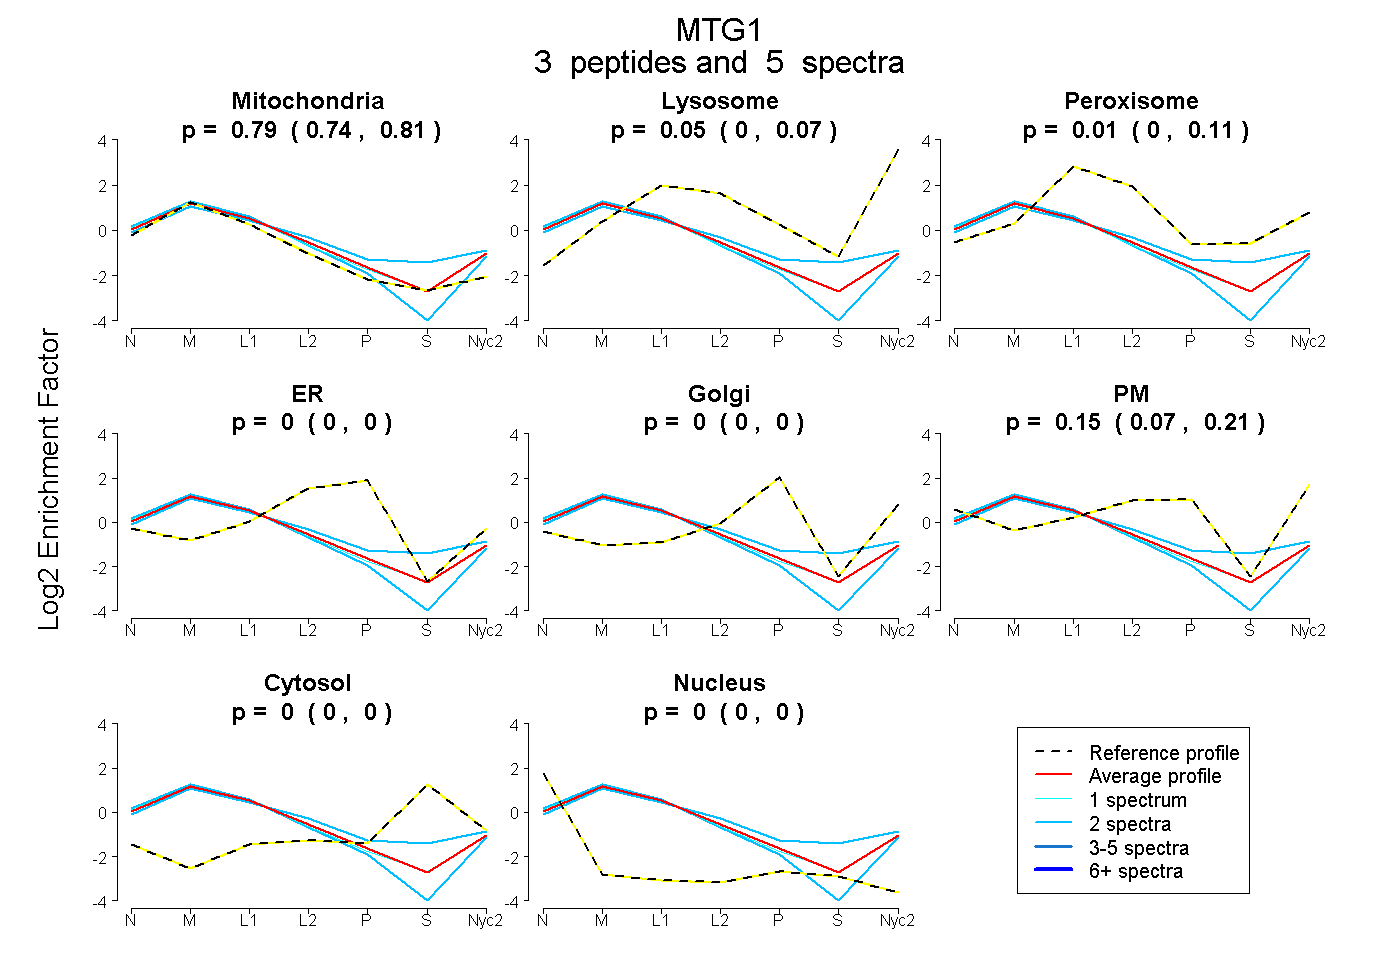
| Plot | Mito | Lyso | Perox | ER | Golgi | PM | Cytosol | Nucleus | |||||
| Expt A |
3 peptides |
5 spectra |
|
0.788 0.739 | 0.806 |
0.050 0.000 | 0.065 |
0.012 0.000 | 0.108 |
0.000 0.000 | 0.000 |
0.000 0.000 | 0.000 |
0.151 0.073 | 0.207 |
0.000 0.000 | 0.003 |
0.000 0.000 | 0.000 |
||
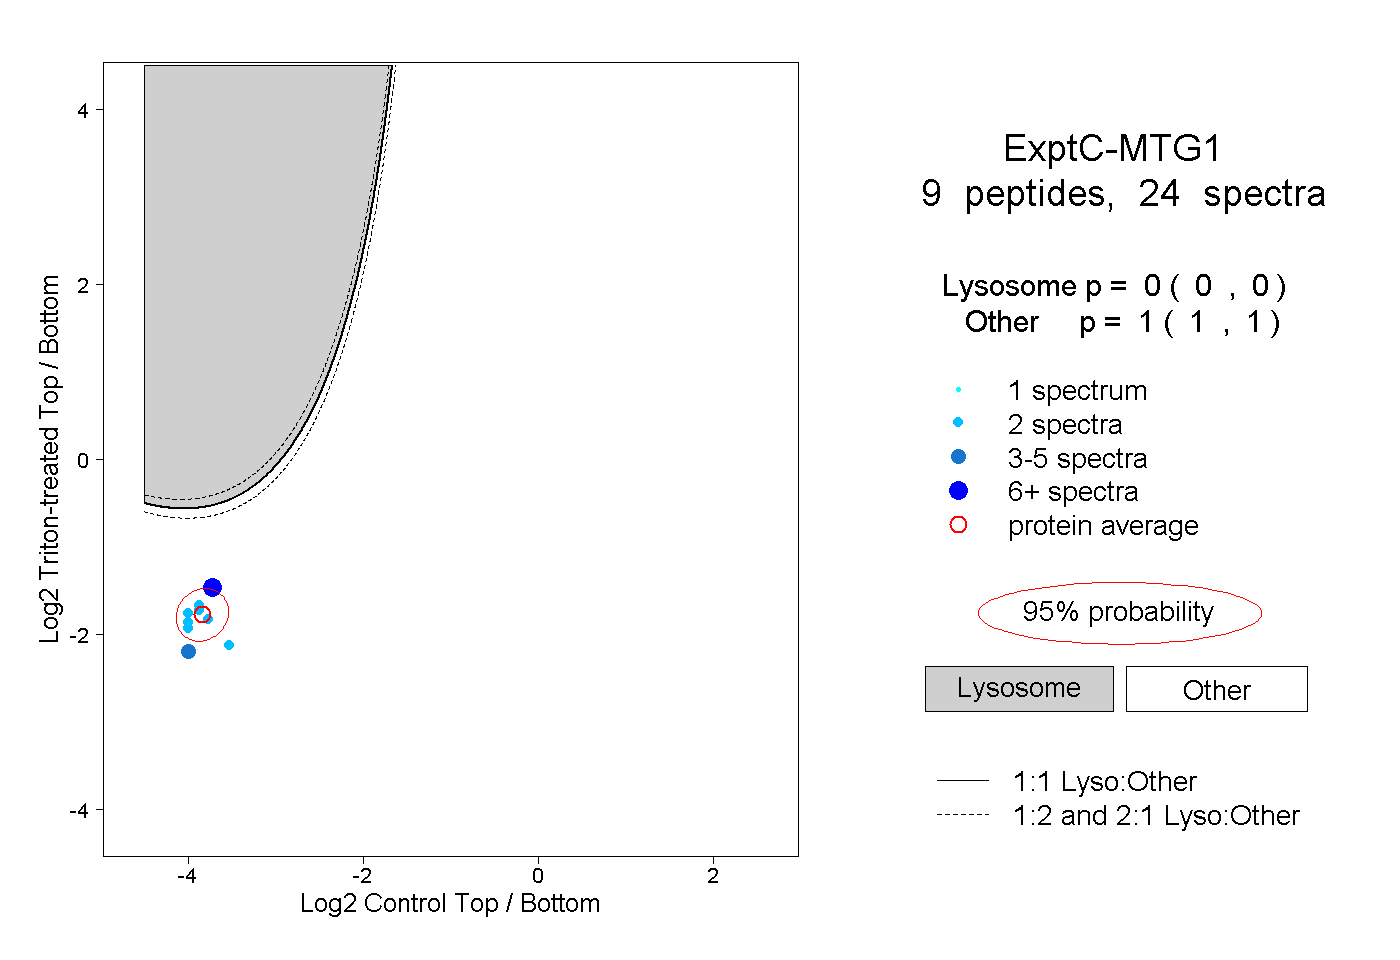
| Plot | Lyso | Other | |||||||||||
| Expt C |
9 peptides |
24 spectra |
|
0.000 0.000 | 0.000 |
1.000 1.000 | 1.000 |
| 2 spectra, IQSVETGLK | 0.000 | 1.000 | ||||||||
| 2 spectra, ECFPLQGHDVAR | 0.000 | 1.000 | ||||||||
| 2 spectra, LVDCVIEVHDAR | 0.000 | 1.000 | ||||||||
| 2 spectra, MDLADLTEQQK | 0.000 | 1.000 | ||||||||
| 7 spectra, VGGEPGITR | 0.000 | 1.000 | ||||||||
| 2 spectra, VTELIGCSYR | 0.000 | 1.000 | ||||||||
| 2 spectra, IPFSGR | 0.000 | 1.000 | ||||||||
| 3 spectra, IVQHLEEK | 0.000 | 1.000 | ||||||||
| 2 spectra, SSLINSLR | 0.000 | 1.000 |
| Plot | Lyso | Other | |||||||||||
| Expt D |
2 peptides |
5 spectra |
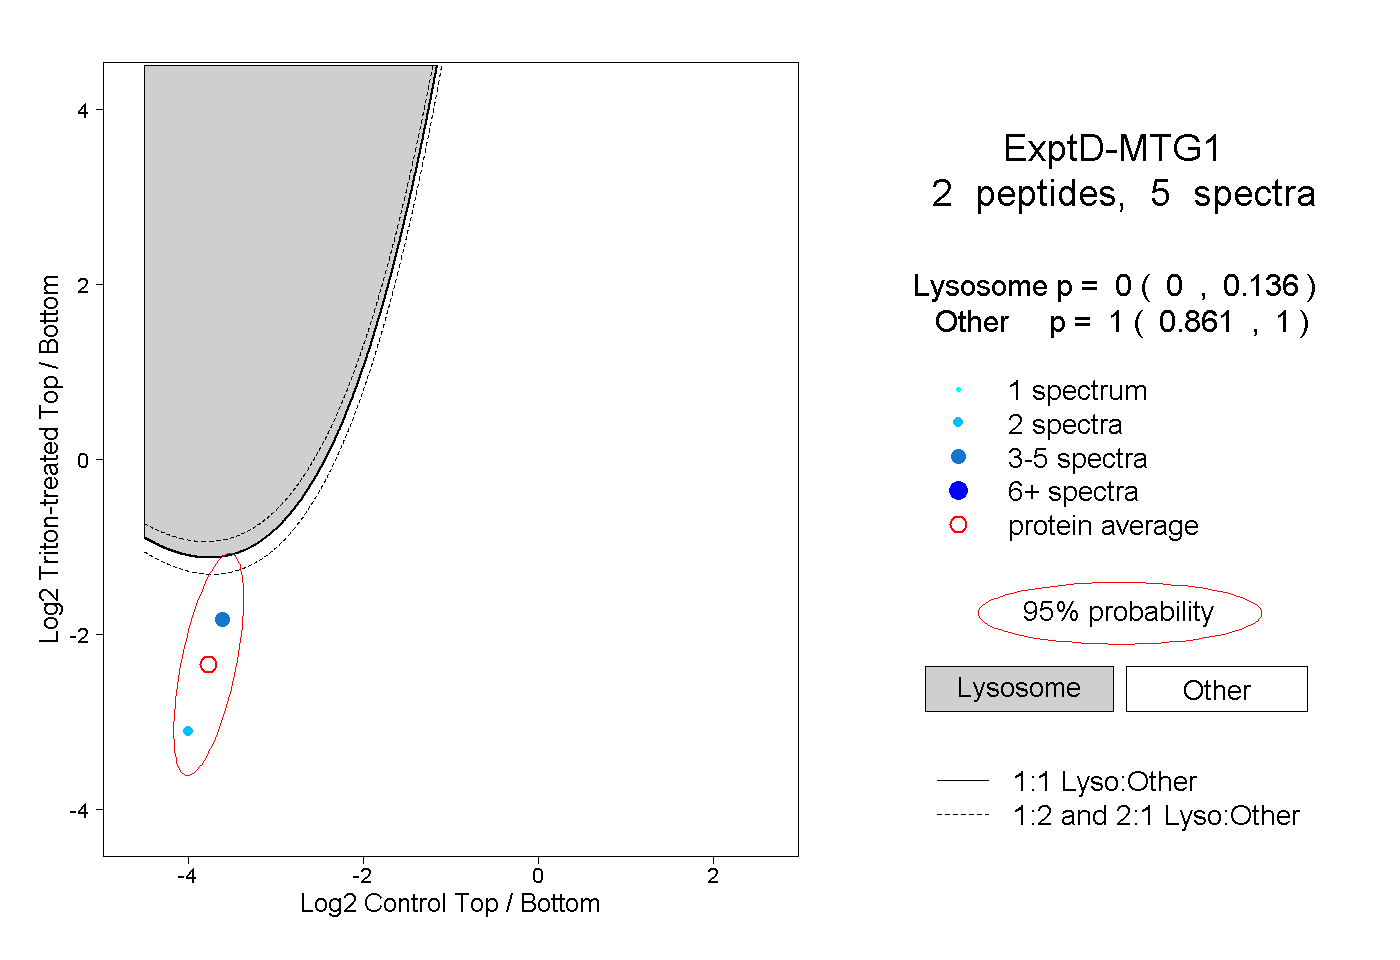 |
0.000 0.000 | 0.136 |
1.000 0.861 | 1.000 |