 10
10peptides
spectra
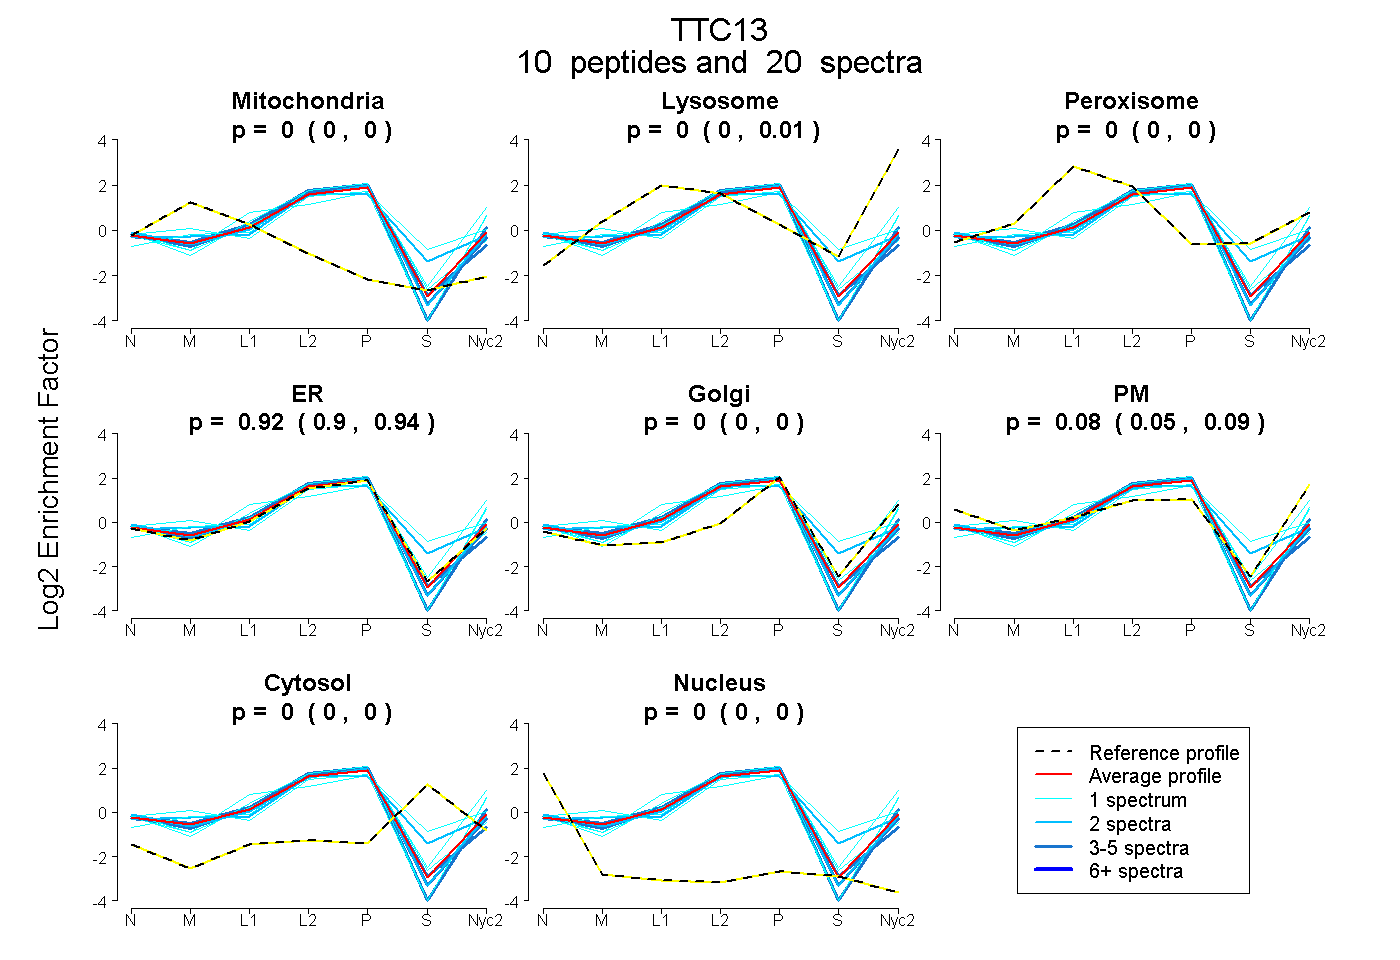
0.000 | 0.001
0.000 | 0.011
0.000 | 0.000
0.901 | 0.942
0.000 | 0.000
0.051 | 0.093
0.000 | 0.000
0.000 | 0.000
3peptides
spectra
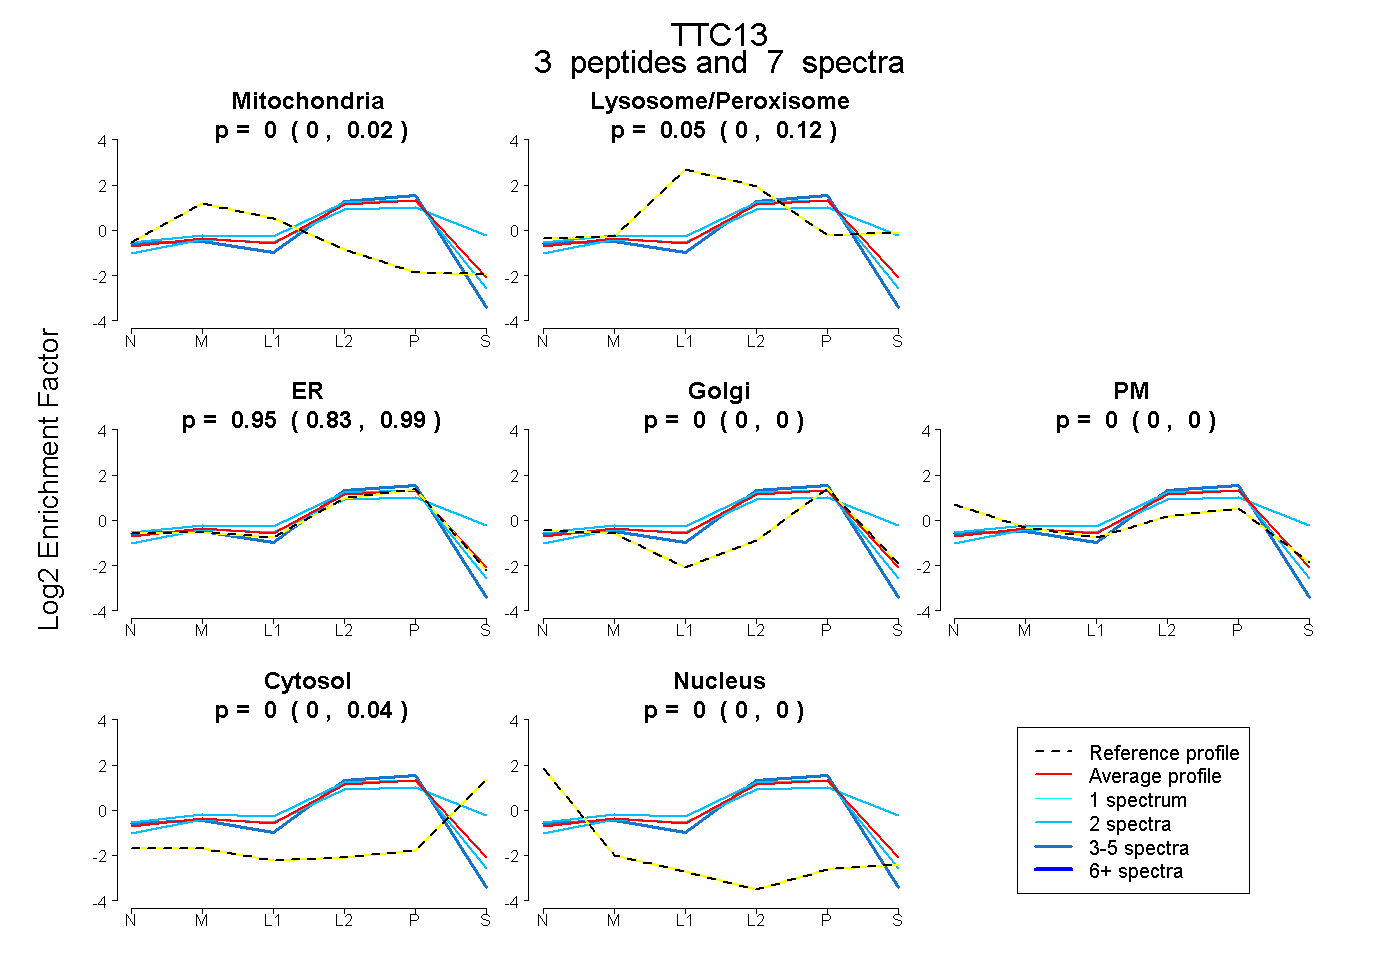
0.000 | 0.025
0.000 | 0.115
0.827 | 0.991
0.000 | 0.000
0.000 | 0.000
0.000 | 0.042
0.000 | 0.000
9peptides
spectra
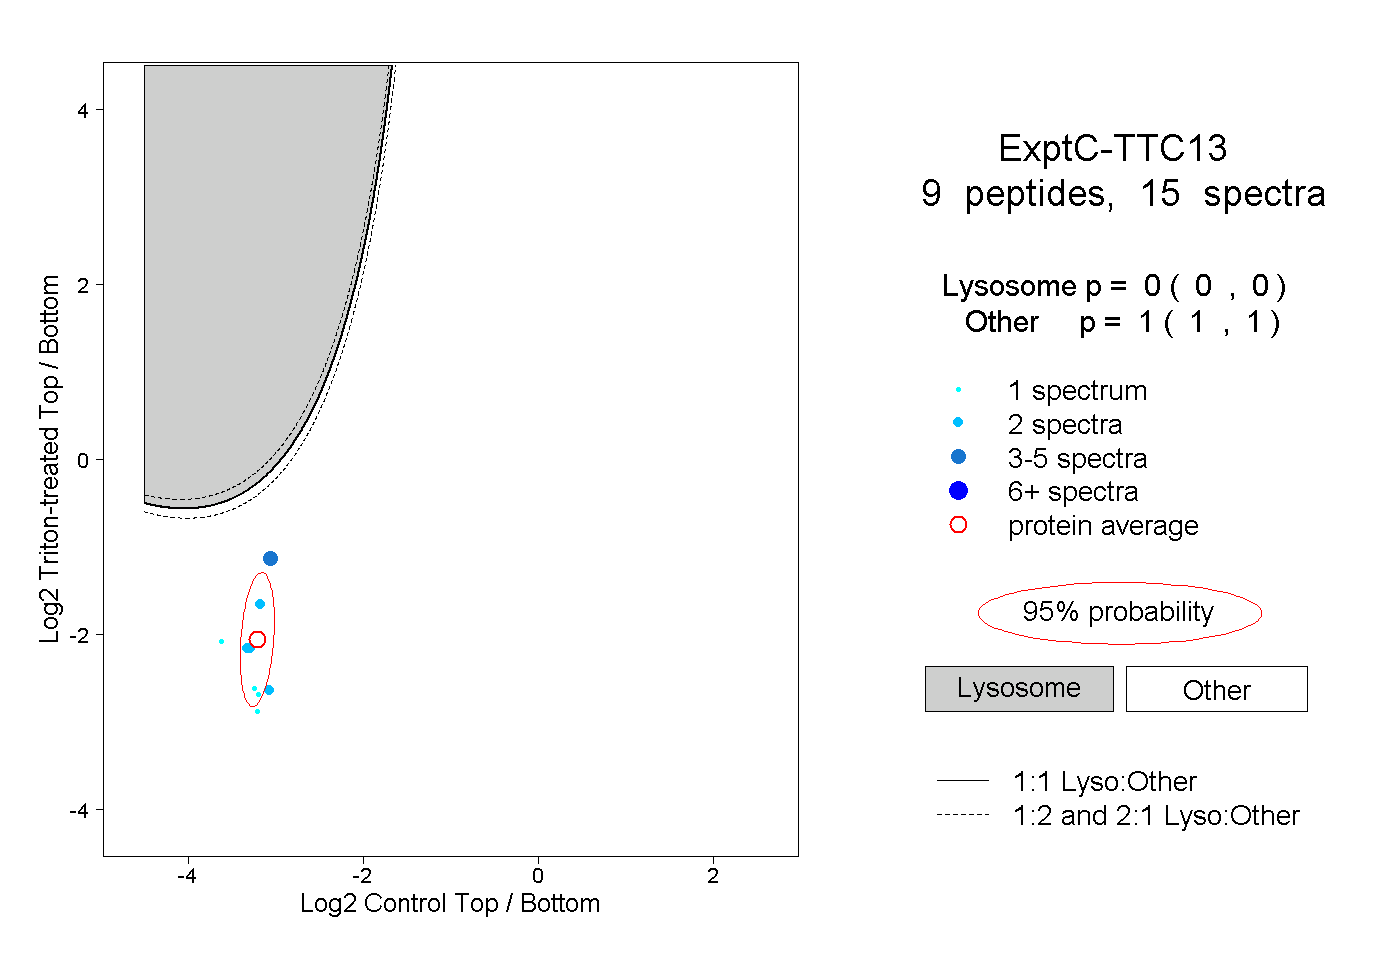
0.000 | 0.000
1.000 | 1.000
2peptides
spectra
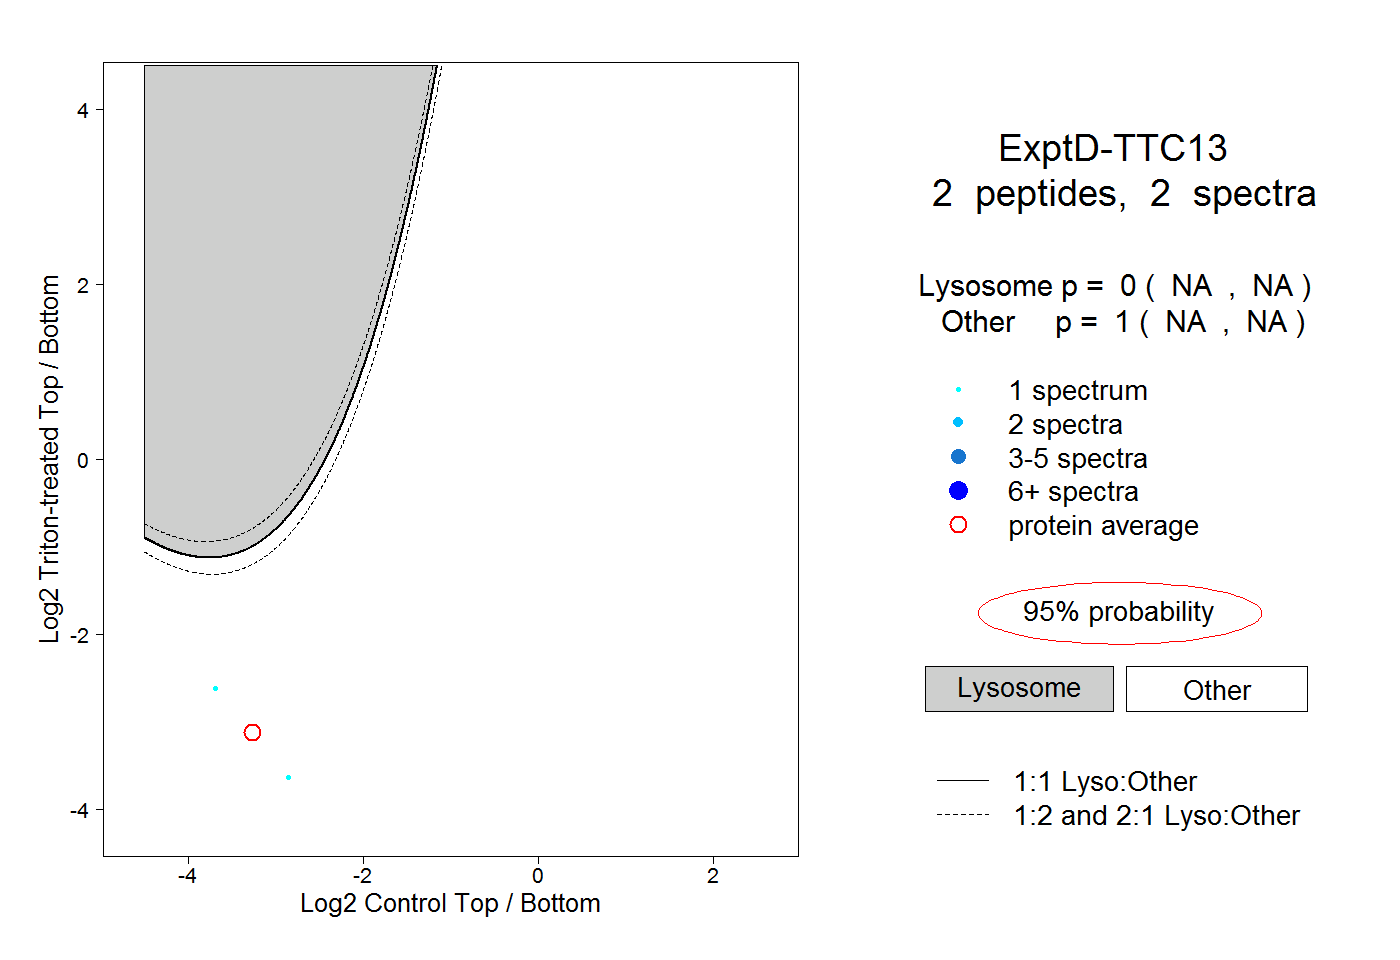
NA | NA
NA | NA