 10
10peptides
spectra
0.000 | 0.001
0.000 | 0.011
0.000 | 0.000
0.901 | 0.942
0.000 | 0.000
0.051 | 0.093
0.000 | 0.000
0.000 | 0.000
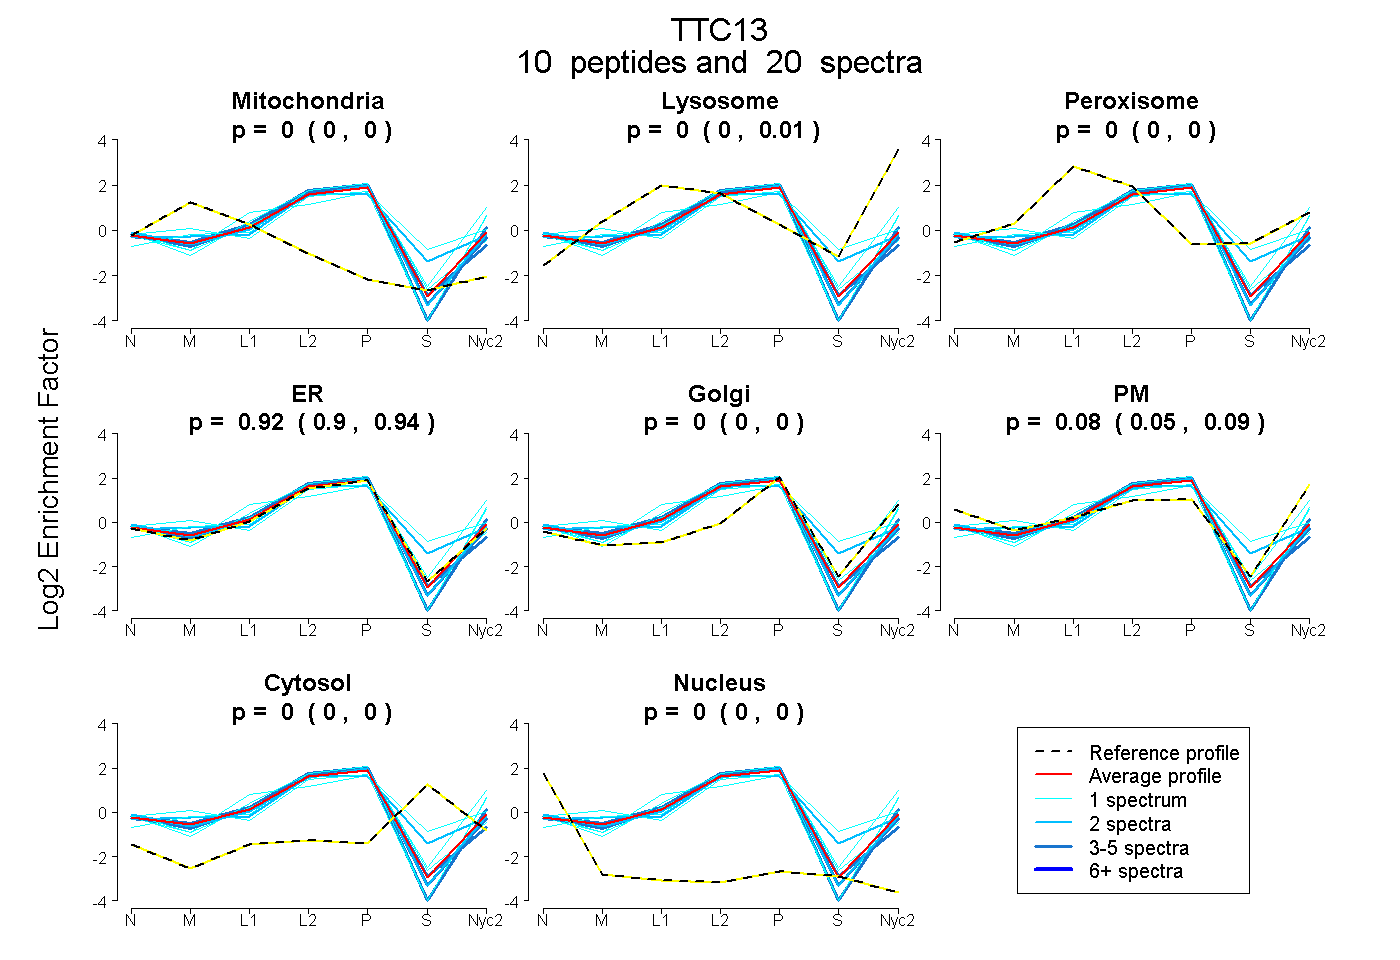
| Plot | Mito | Lyso | Perox | ER | Golgi | PM | Cytosol | Nucleus | |||||
| Expt A |
10 peptides |
20 spectra |
|
0.000 0.000 | 0.001 |
0.000 0.000 | 0.011 |
0.000 0.000 | 0.000 |
0.922 0.901 | 0.942 |
0.000 0.000 | 0.000 |
0.078 0.051 | 0.093 |
0.000 0.000 | 0.000 |
0.000 0.000 | 0.000 |
| 1 spectrum, INEAVNDLTK | 0.008 | 0.000 | 0.000 | 0.654 | 0.001 | 0.337 | 0.000 | 0.000 | ||
| 1 spectrum, ILVYHGANNPK | 0.000 | 0.083 | 0.000 | 0.546 | 0.077 | 0.294 | 0.000 | 0.000 | ||
| 2 spectra, YLEYFEK | 0.000 | 0.000 | 0.000 | 0.958 | 0.000 | 0.042 | 0.000 | 0.000 | ||
| 4 spectra, AIQLQPSAR | 0.000 | 0.000 | 0.000 | 0.902 | 0.000 | 0.098 | 0.000 | 0.000 | ||
| 3 spectra, ALLLNQNHVQTLQLR | 0.024 | 0.000 | 0.000 | 0.976 | 0.000 | 0.000 | 0.000 | 0.000 | ||
| 4 spectra, ILHFIK | 0.000 | 0.000 | 0.000 | 1.000 | 0.000 | 0.000 | 0.000 | 0.000 | ||
| 2 spectra, GLTFFHR | 0.000 | 0.009 | 0.115 | 0.777 | 0.000 | 0.000 | 0.099 | 0.000 | ||
| 1 spectrum, VEDLLPIMK | 0.000 | 0.037 | 0.000 | 0.819 | 0.000 | 0.143 | 0.000 | 0.000 | ||
| 1 spectrum, ASPEYLR | 0.000 | 0.000 | 0.271 | 0.512 | 0.104 | 0.000 | 0.113 | 0.000 | ||
| 1 spectrum, EAIEAFK | 0.000 | 0.000 | 0.009 | 0.991 | 0.000 | 0.000 | 0.000 | 0.000 |
| Plot | Mito | Lyso or Perox | ER | Golgi | PM | Cytosol | Nucleus | ||||||
| Expt B |
3 peptides |
7 spectra |
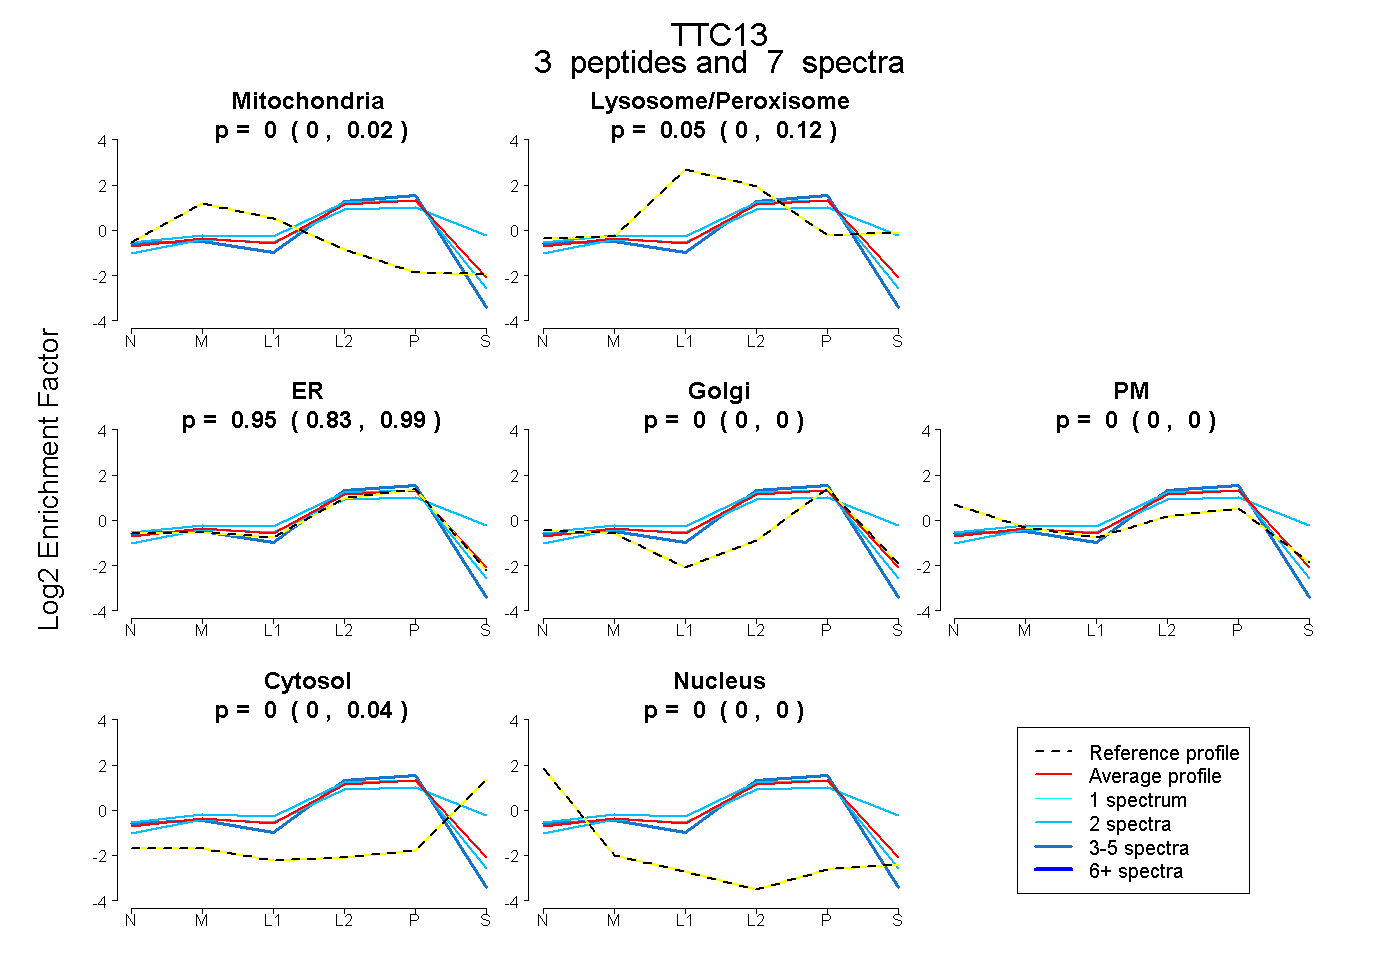 |
0.000 0.000 | 0.025 |
0.054 0.000 | 0.115 |
0.946 0.827 | 0.991 |
0.000 0.000 | 0.000 |
0.000 0.000 | 0.000 |
0.000 0.000 | 0.042 |
0.000 0.000 | 0.000 |
|||
| Plot | Lyso | Other | |||||||||||
| Expt C |
9 peptides |
15 spectra |
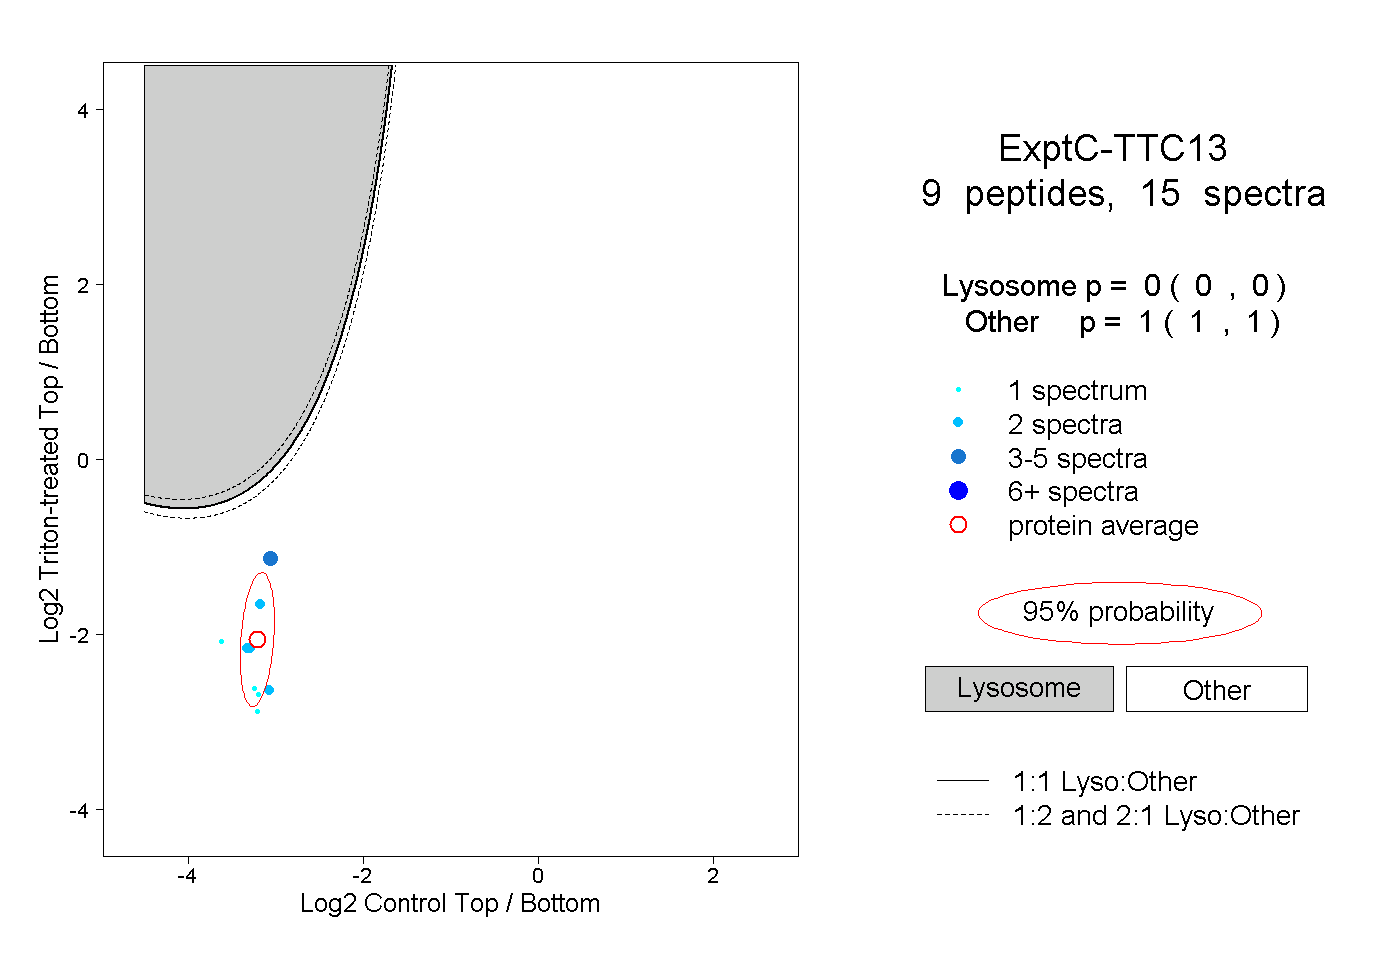 |
0.000 0.000 | 0.000 |
1.000 1.000 | 1.000 |
||||||||
| Plot | Lyso | Other | |||||||||||
| Expt D |
2 peptides |
2 spectra |
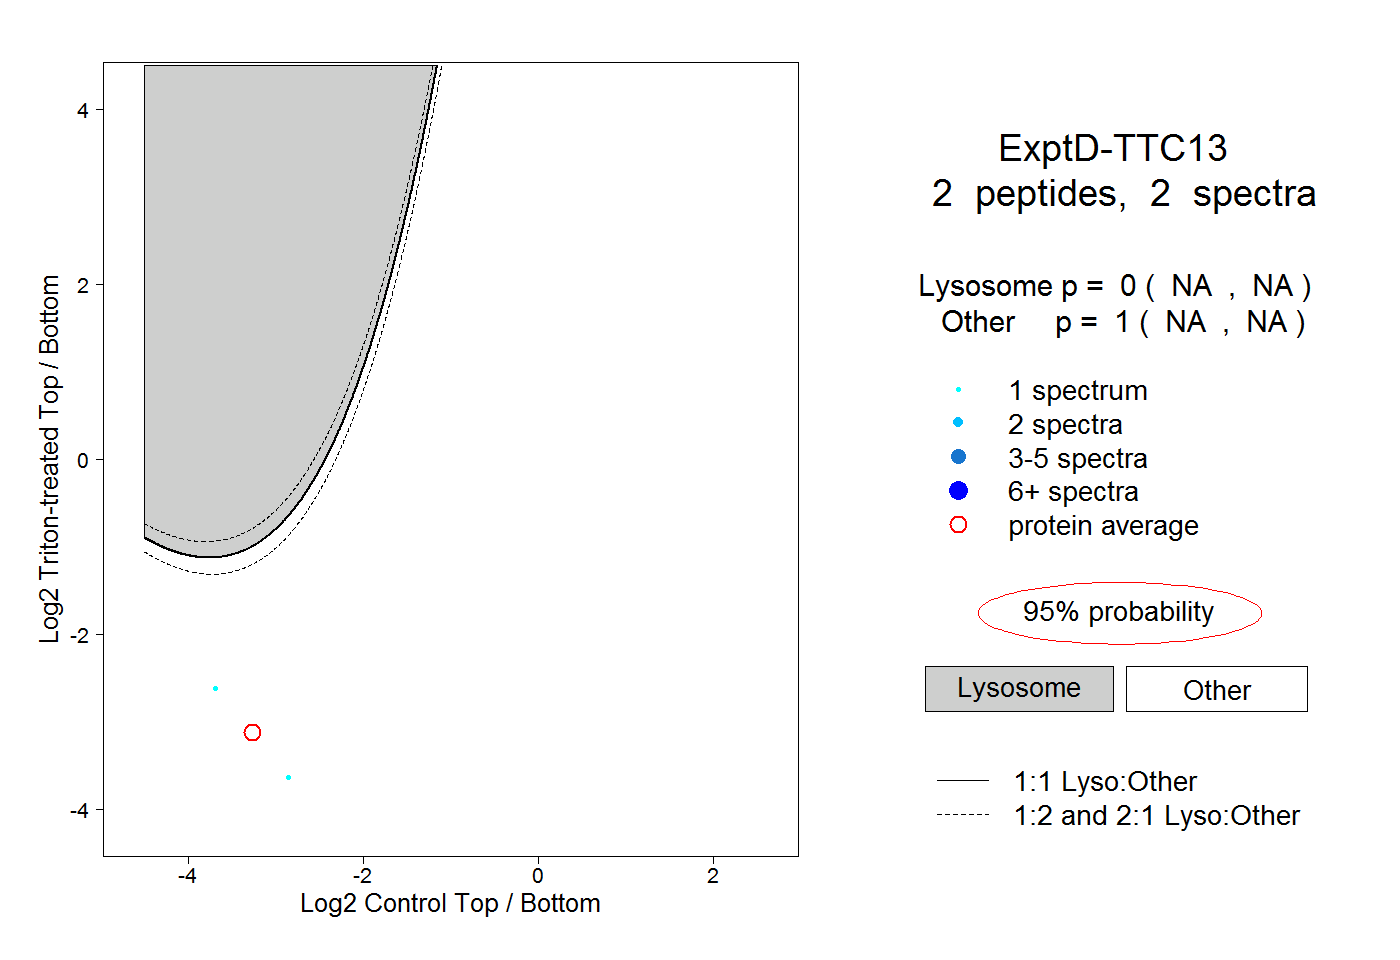 |
0.000 NA | NA |
1.000 NA | NA |