 4
4peptides
spectra
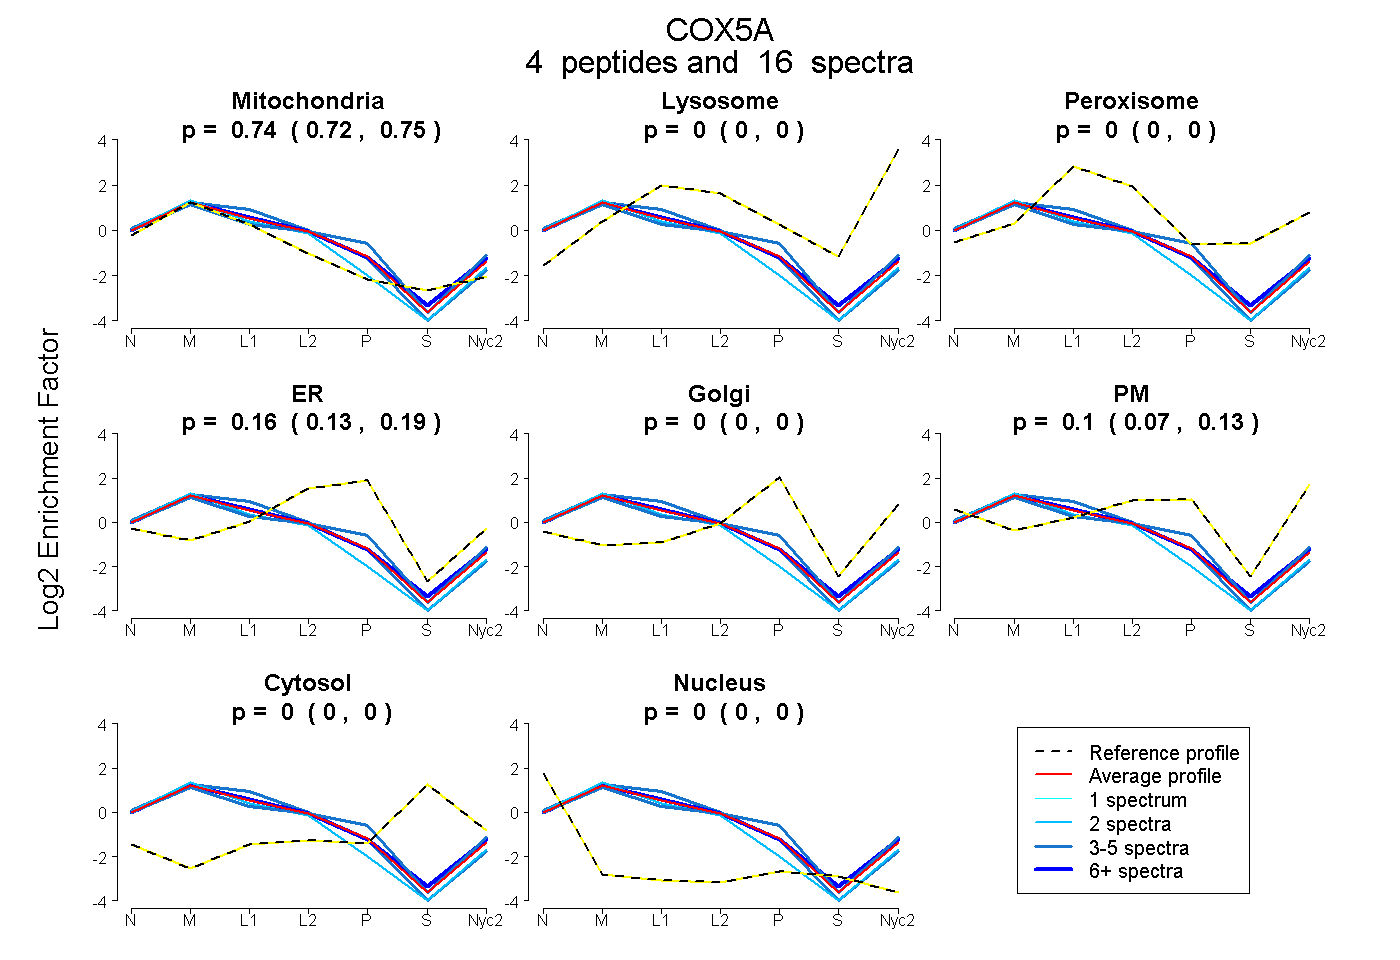
0.722 | 0.751
0.000 | 0.000
0.000 | 0.000
0.128 | 0.189
0.000 | 0.000
0.068 | 0.127
0.000 | 0.000
0.000 | 0.000
5peptides
spectra
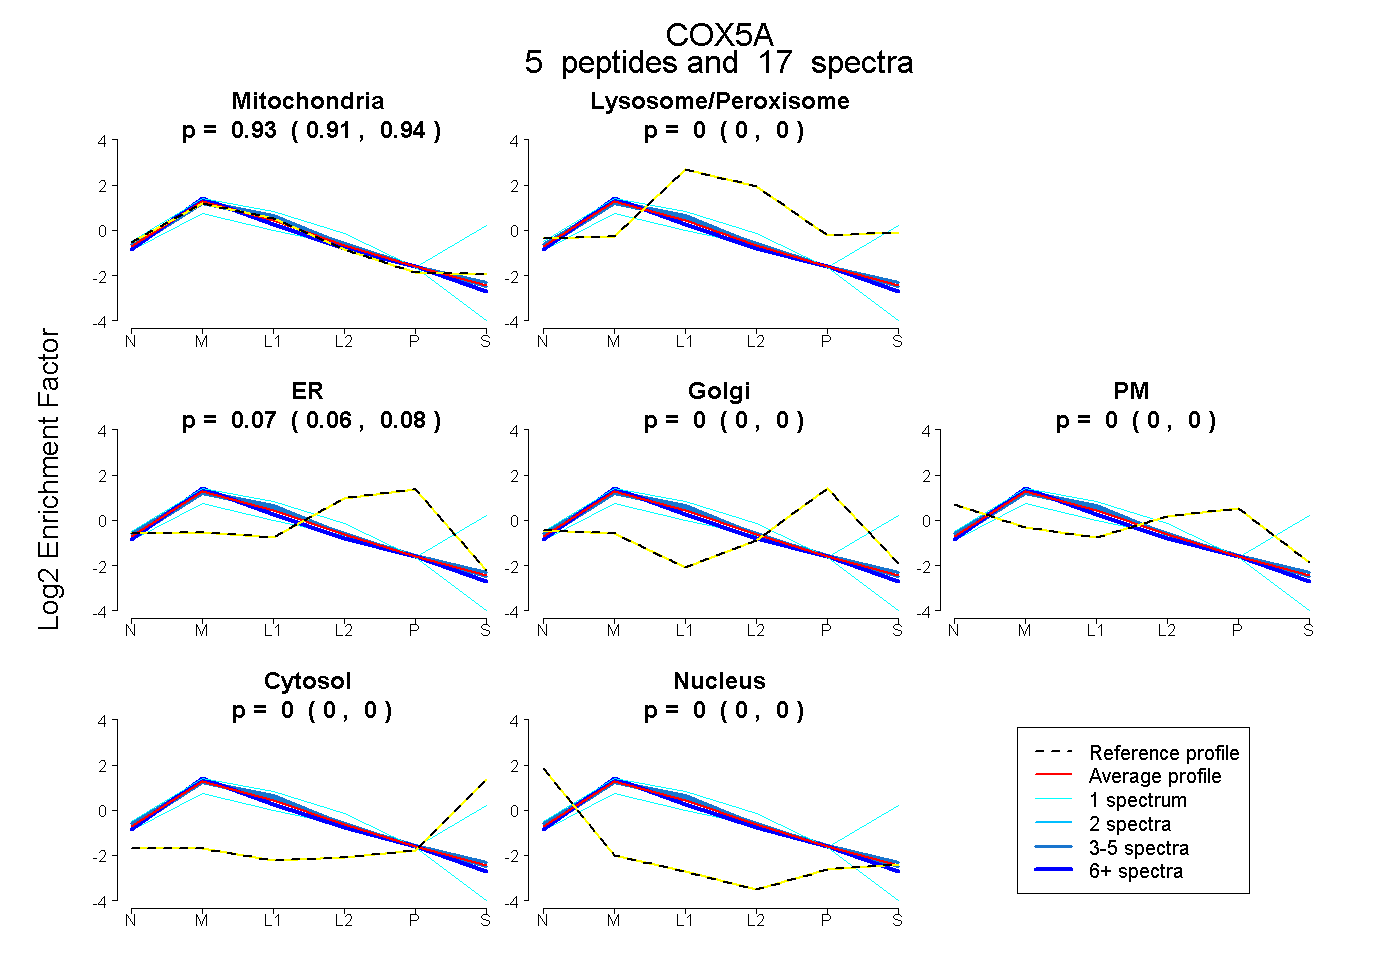
0.915 | 0.938
0.000 | 0.000
0.060 | 0.083
0.000 | 0.000
0.000 | 0.000
0.000 | 0.000
0.000 | 0.000
5peptides
spectra
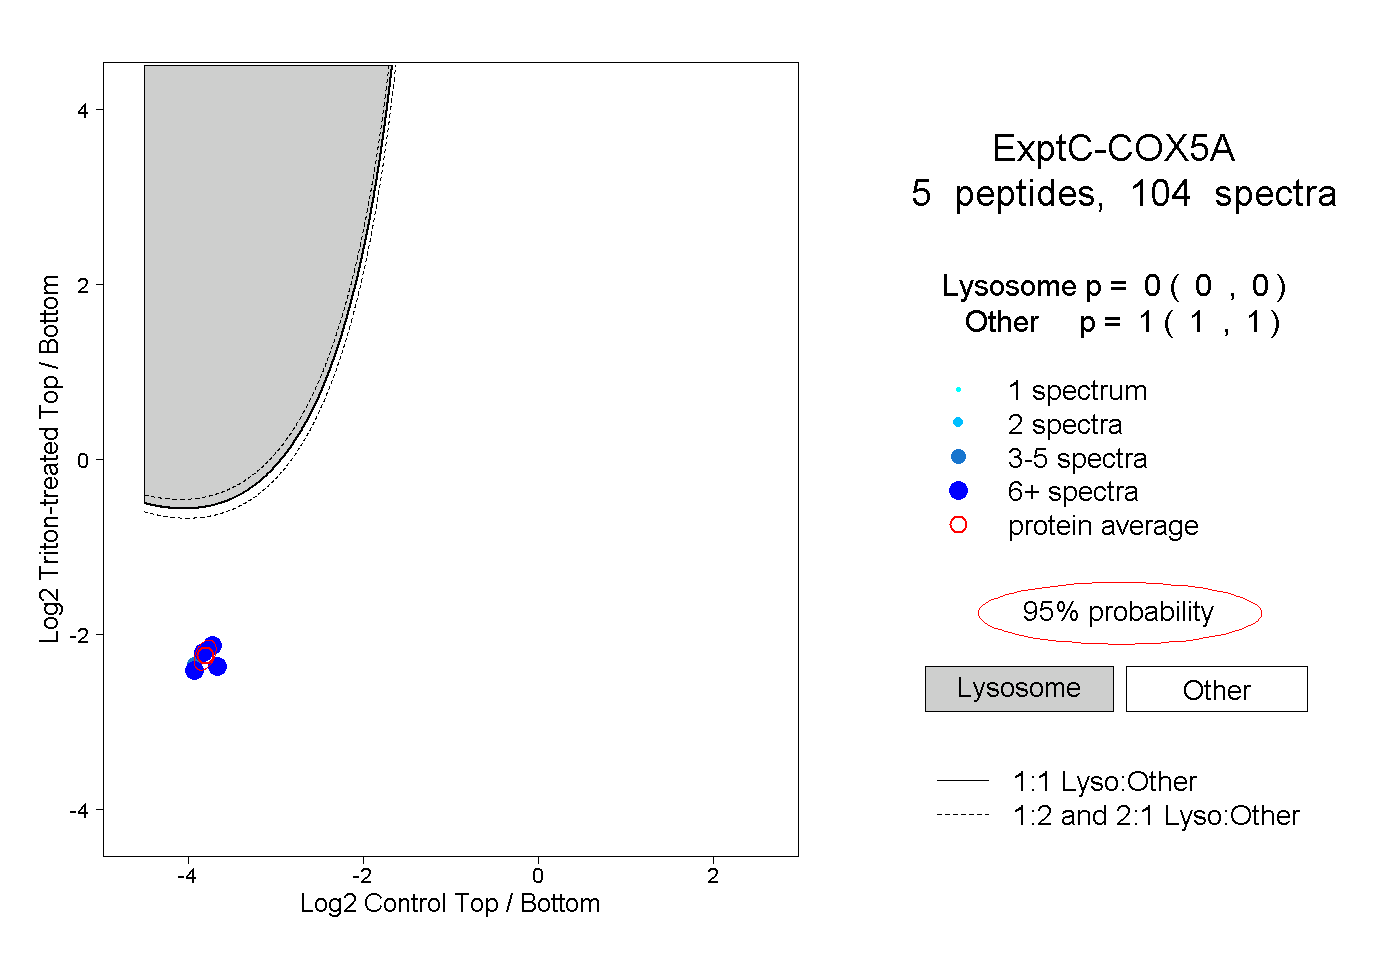
0.000 | 0.000
1.000 | 1.000
2peptides
spectra
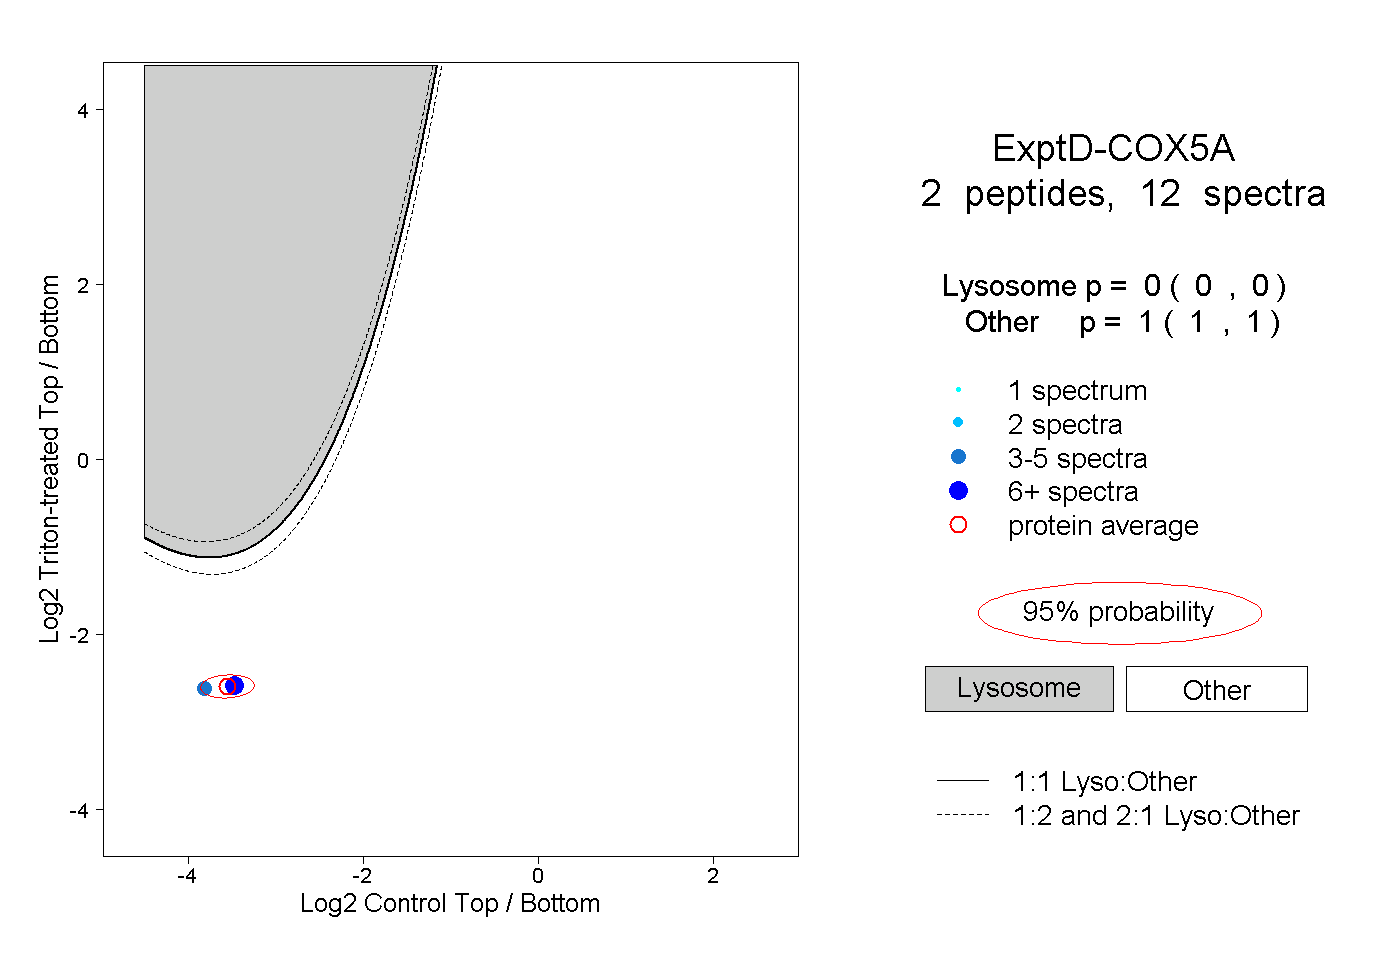
0.000 | 0.000
1.000 | 1.000