 4
4peptides
spectra
0.722 | 0.751
0.000 | 0.000
0.000 | 0.000
0.128 | 0.189
0.000 | 0.000
0.068 | 0.127
0.000 | 0.000
0.000 | 0.000
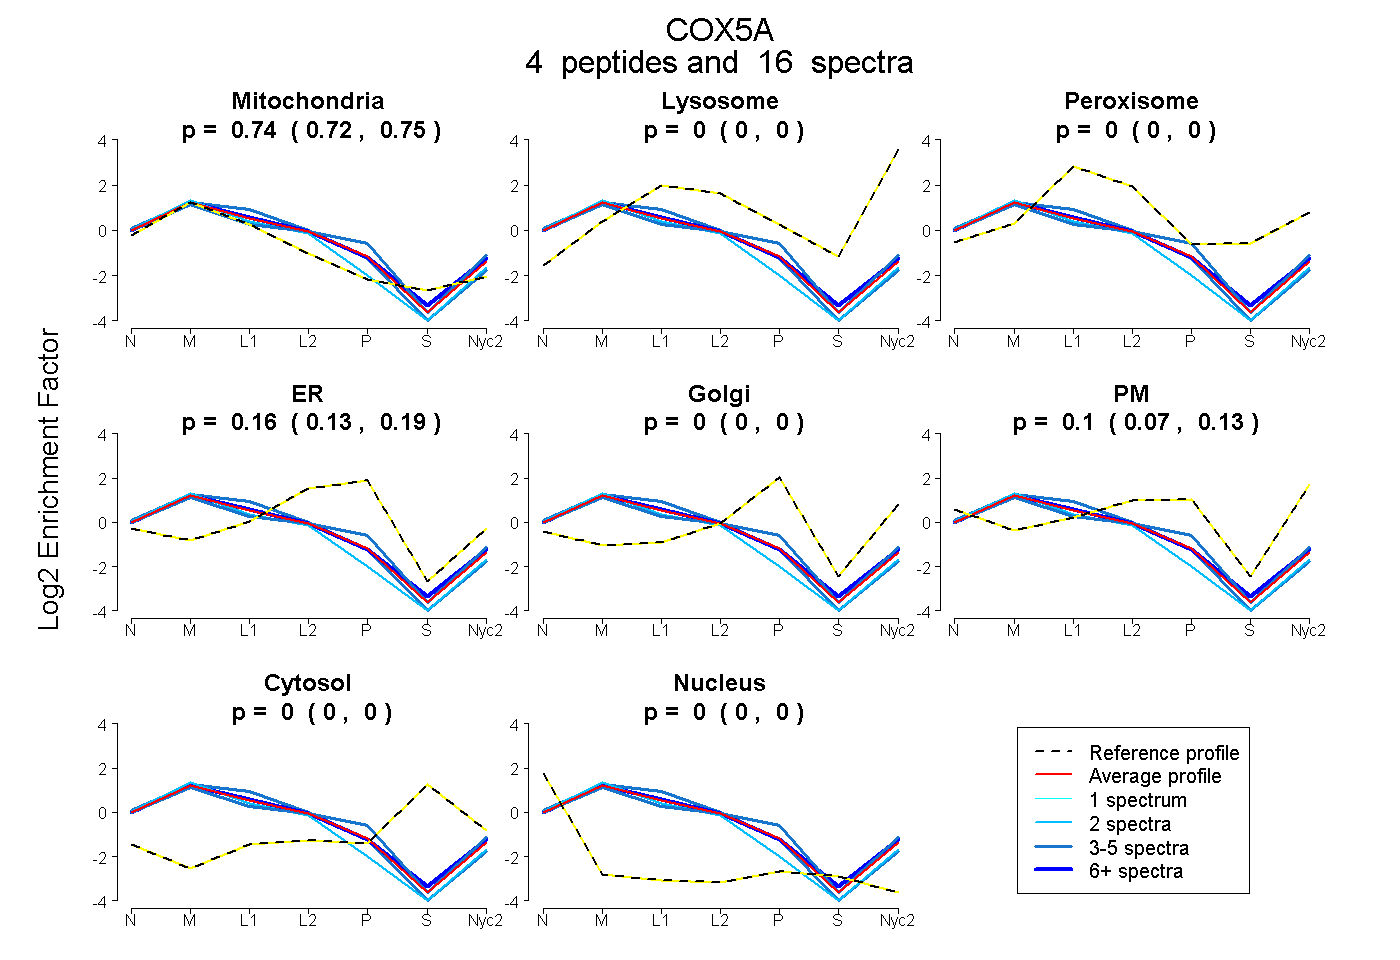
| Plot | Mito | Lyso | Perox | ER | Golgi | PM | Cytosol | Nucleus | |||||
| Expt A |
4 peptides |
16 spectra |
|
0.739 0.722 | 0.751 |
0.000 0.000 | 0.000 |
0.000 0.000 | 0.000 |
0.161 0.128 | 0.189 |
0.000 0.000 | 0.000 |
0.100 0.068 | 0.127 |
0.000 0.000 | 0.000 |
0.000 0.000 | 0.000 |
| 7 spectra, IIDAALR | 0.732 | 0.004 | 0.002 | 0.114 | 0.000 | 0.148 | 0.000 | 0.000 | ||
| 2 spectra, ILEVVK | 0.880 | 0.000 | 0.000 | 0.054 | 0.000 | 0.066 | 0.000 | 0.000 | ||
| 4 spectra, LNDFASAVR | 0.638 | 0.000 | 0.000 | 0.244 | 0.000 | 0.118 | 0.000 | 0.000 | ||
| 3 spectra, GMNTLVGYDLVPEPK | 0.777 | 0.000 | 0.000 | 0.223 | 0.000 | 0.000 | 0.000 | 0.000 |
| Plot | Mito | Lyso or Perox | ER | Golgi | PM | Cytosol | Nucleus | ||||||
| Expt B |
5 peptides |
17 spectra |
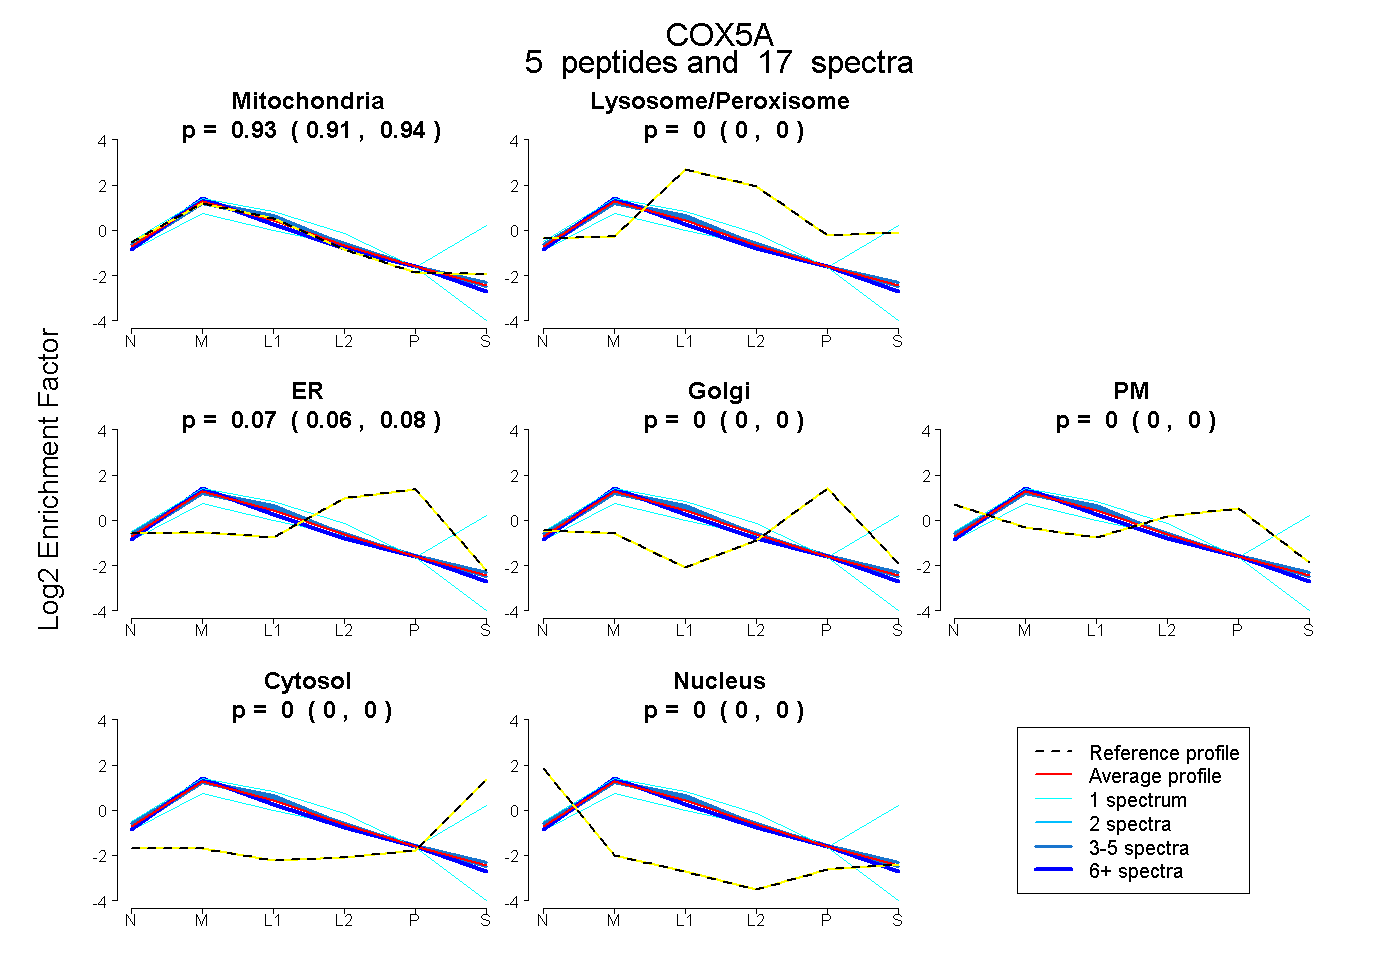 |
0.928 0.915 | 0.938 |
0.000 0.000 | 0.000 |
0.072 0.060 | 0.083 |
0.000 0.000 | 0.000 |
0.000 0.000 | 0.000 |
0.000 0.000 | 0.000 |
0.000 0.000 | 0.000 |
|||
| Plot | Lyso | Other | |||||||||||
| Expt C |
5 peptides |
104 spectra |
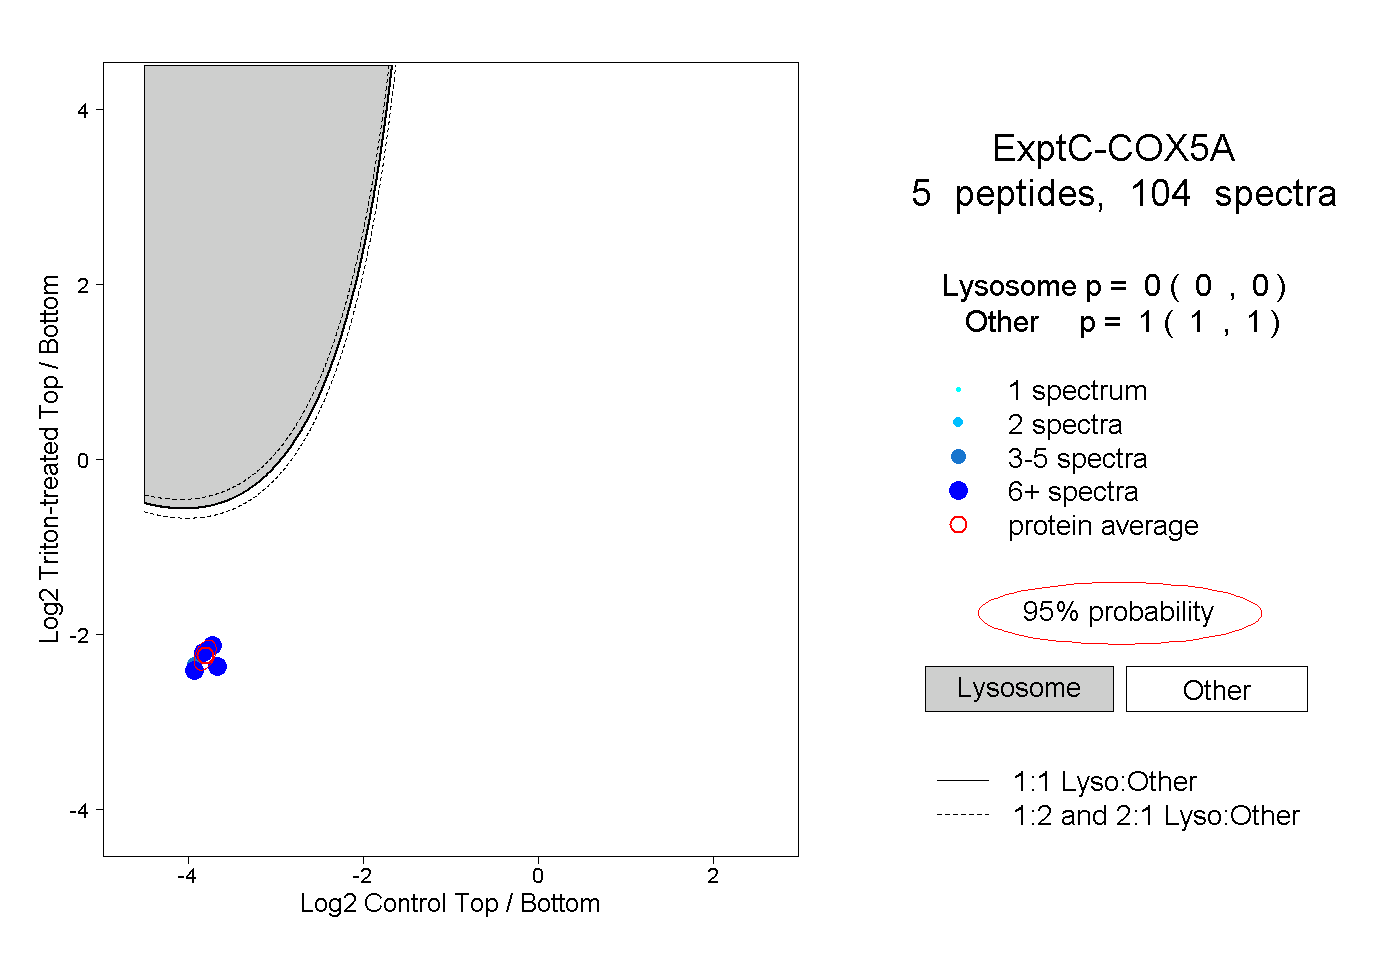 |
0.000 0.000 | 0.000 |
1.000 1.000 | 1.000 |
||||||||
| Plot | Lyso | Other | |||||||||||
| Expt D |
2 peptides |
12 spectra |
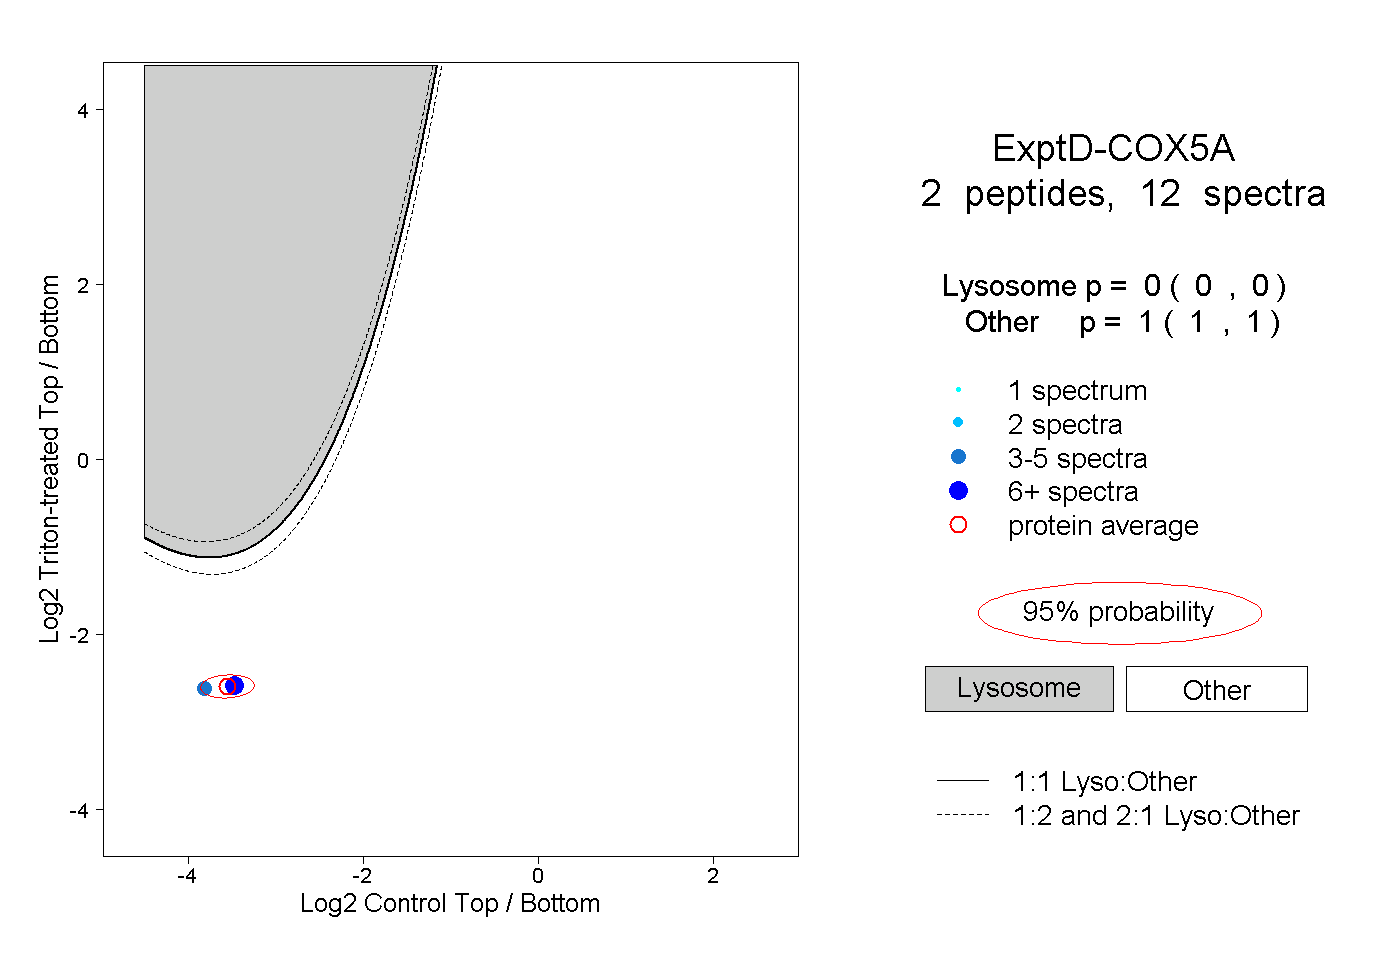 |
0.000 0.000 | 0.000 |
1.000 1.000 | 1.000 |