 5
5peptides
spectra
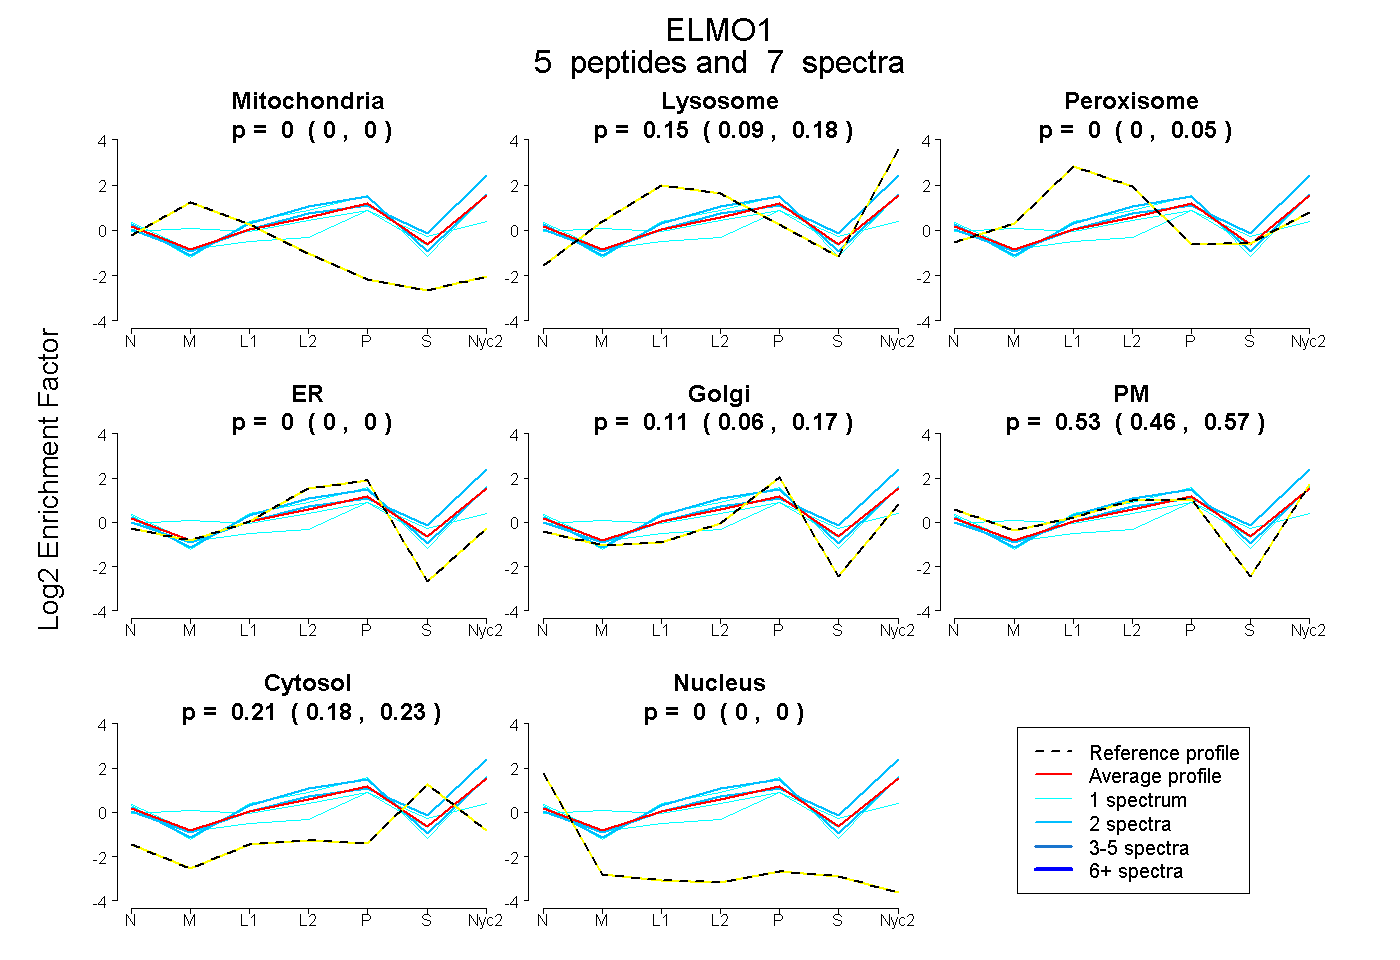
0.000 | 0.000
0.093 | 0.184
0.000 | 0.047
0.000 | 0.000
0.058 | 0.168
0.457 | 0.568
0.183 | 0.230
0.000 | 0.000
4peptides
spectra
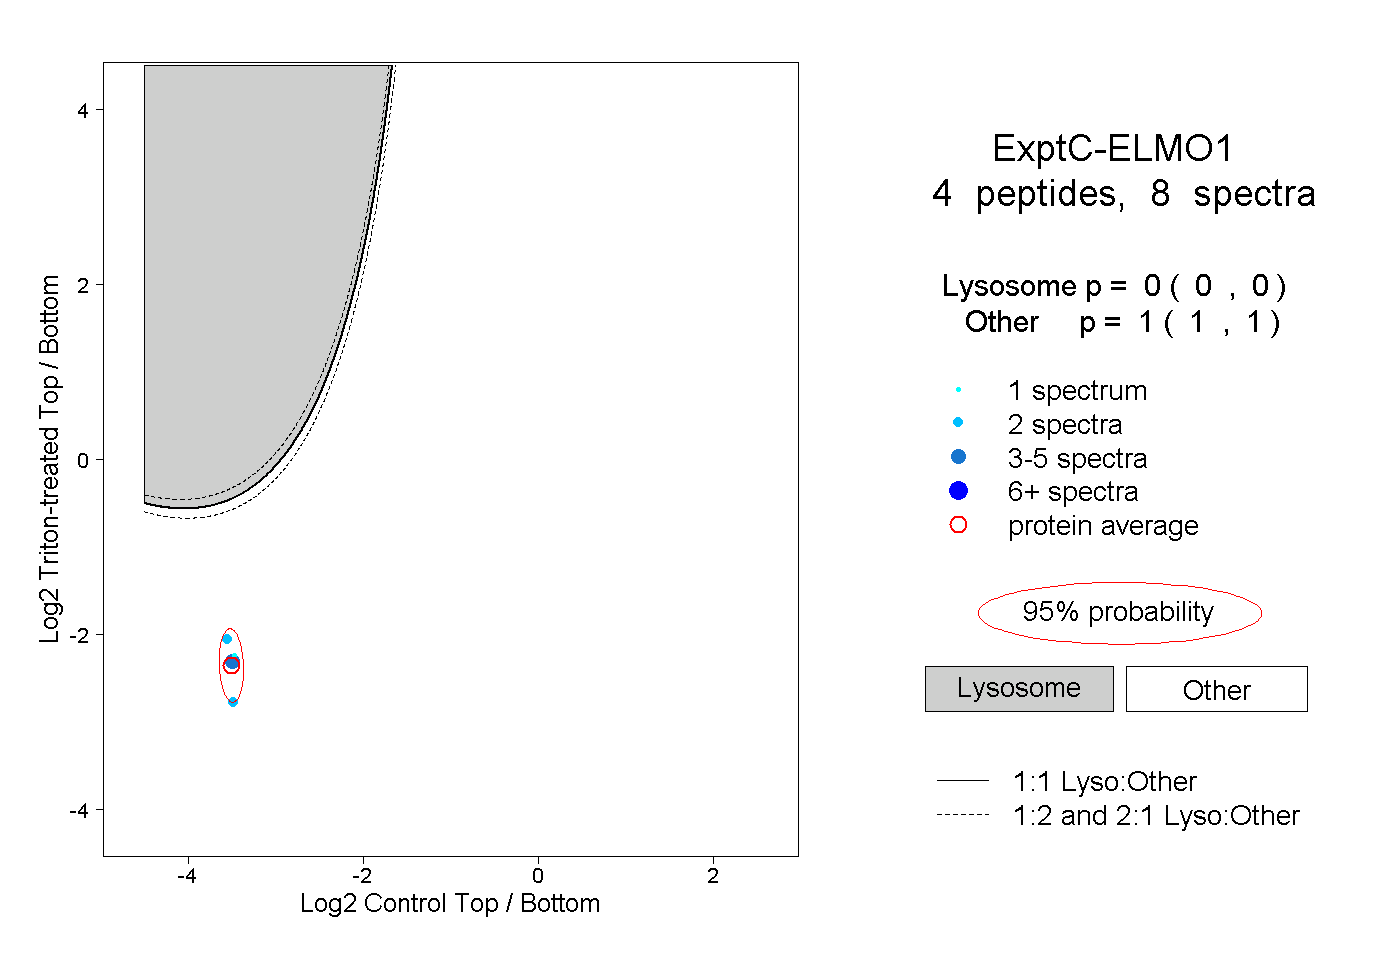
0.000 | 0.000
1.000 | 1.000
1peptide
spectra
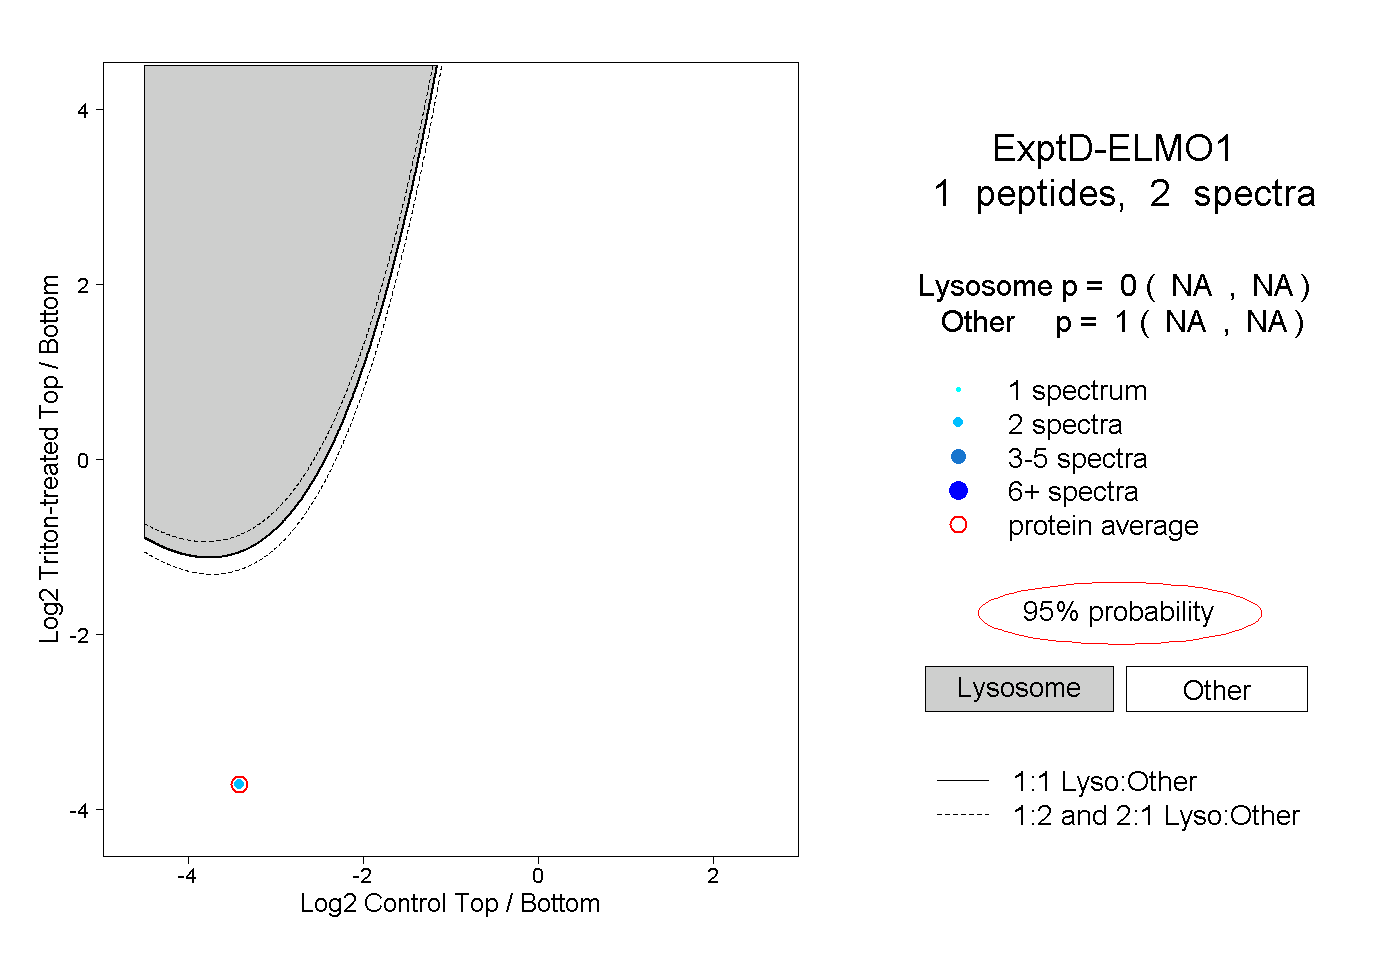
NA | NA
NA | NA