 5
5peptides
spectra
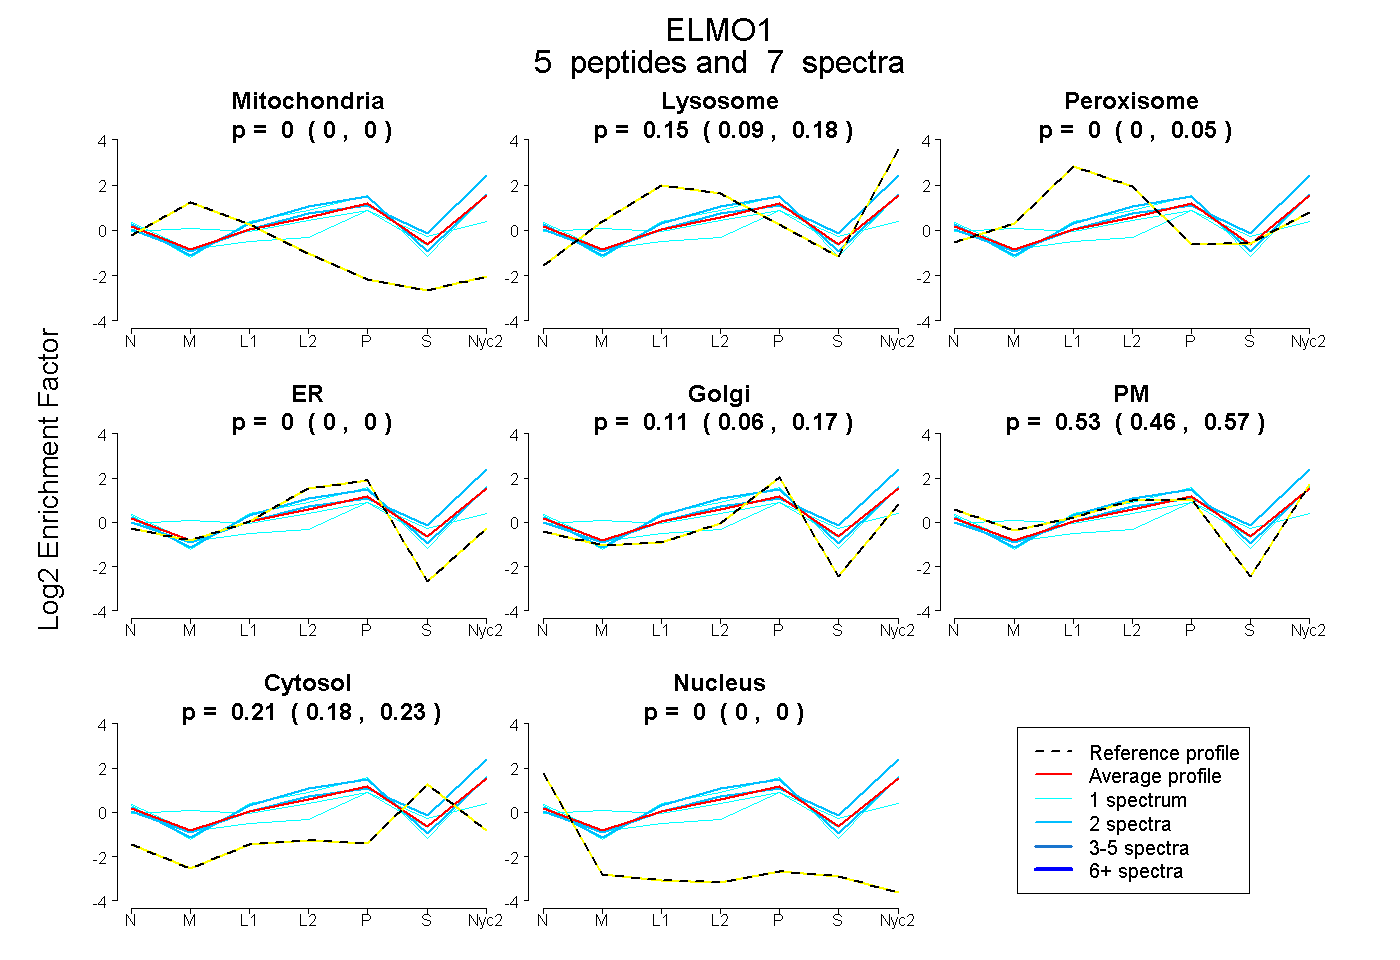
0.000 | 0.000
0.093 | 0.184
0.000 | 0.047
0.000 | 0.000
0.058 | 0.168
0.457 | 0.568
0.183 | 0.230
0.000 | 0.000
| Plot | Mito | Lyso | Perox | ER | Golgi | PM | Cytosol | Nucleus | |||||
| Expt A |
5 peptides |
7 spectra |
|
0.000 0.000 | 0.000 |
0.153 0.093 | 0.184 |
0.000 0.000 | 0.047 |
0.000 0.000 | 0.000 |
0.107 0.058 | 0.168 |
0.529 0.457 | 0.568 |
0.211 0.183 | 0.230 |
0.000 0.000 | 0.000 |
| 2 spectra, YIILTHVIR | 0.000 | 0.159 | 0.000 | 0.126 | 0.057 | 0.519 | 0.138 | 0.000 | ||
| 1 spectrum, IASFVNK | 0.000 | 0.229 | 0.000 | 0.000 | 0.089 | 0.479 | 0.203 | 0.000 | ||
| 1 spectrum, ATSEDFNK | 0.000 | 0.000 | 0.011 | 0.000 | 0.172 | 0.444 | 0.373 | 0.000 | ||
| 1 spectrum, SAIDISILQR | 0.000 | 0.116 | 0.032 | 0.041 | 0.173 | 0.539 | 0.100 | 0.000 | ||
| 2 spectra, LTTSPAQNAQQLHER | 0.000 | 0.329 | 0.000 | 0.000 | 0.058 | 0.394 | 0.219 | 0.000 |
| Plot | Lyso | Other | |||||||||||
| Expt C |
4 peptides |
8 spectra |
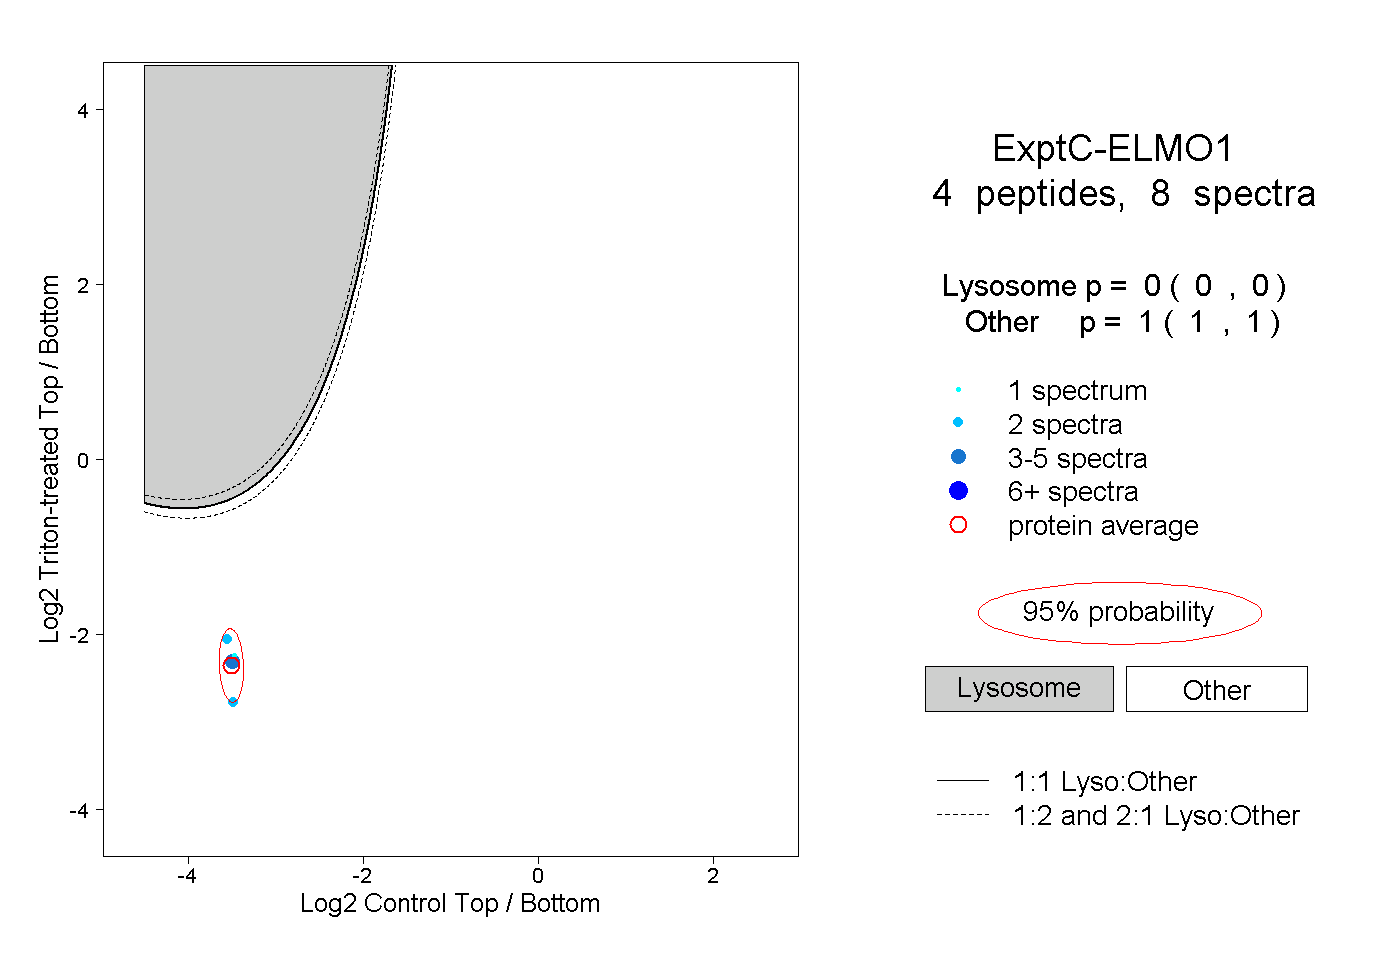 |
0.000 0.000 | 0.000 |
1.000 1.000 | 1.000 |
||||||||
| Plot | Lyso | Other | |||||||||||
| Expt D |
1 peptide |
2 spectra |
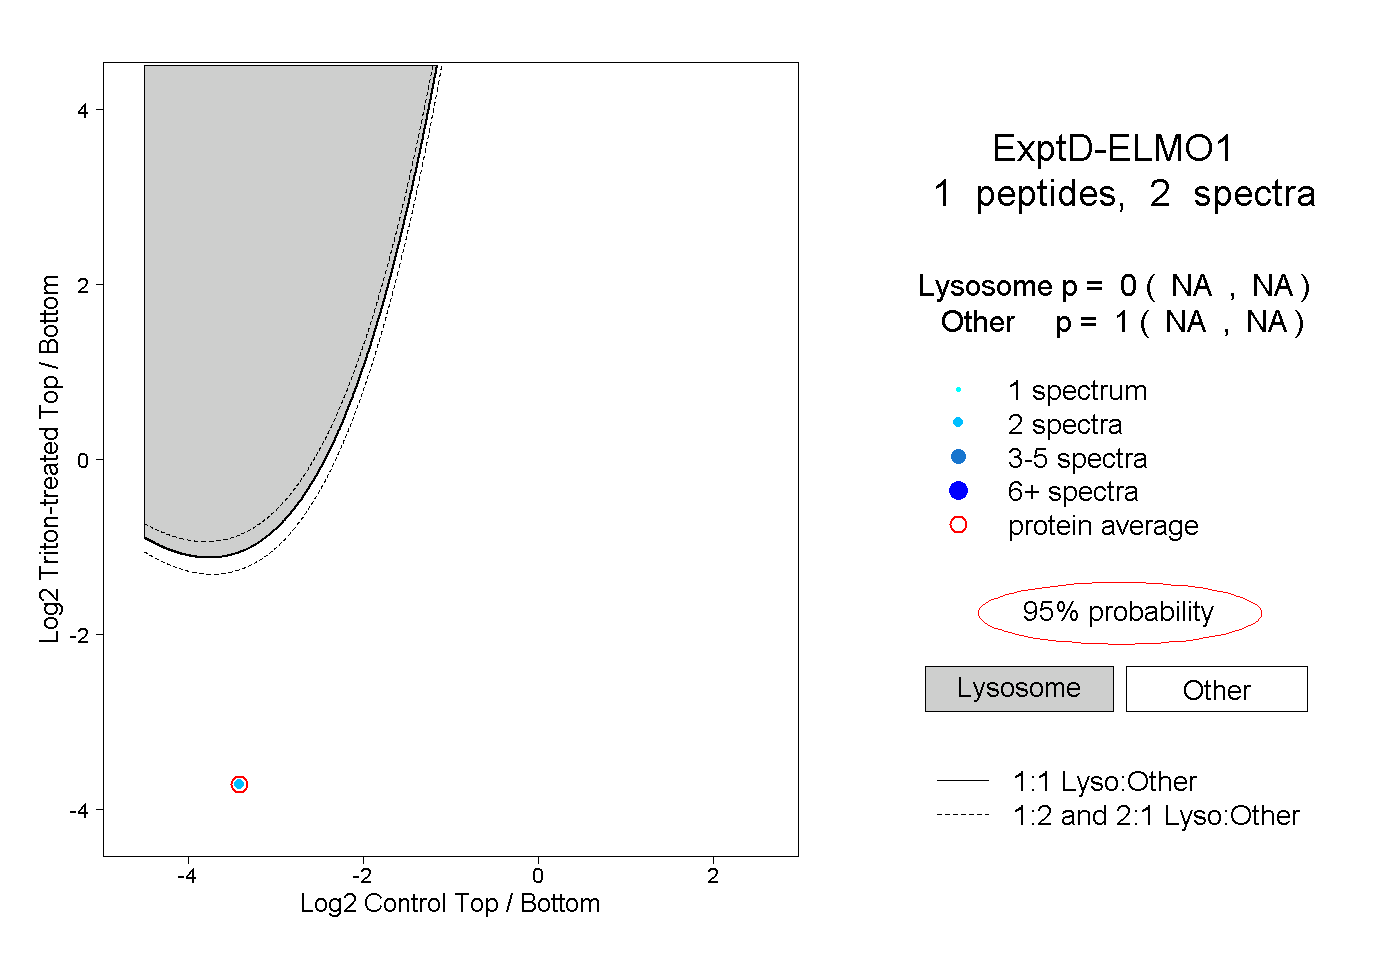 |
0.000 NA | NA |
1.000 NA | NA |