 4
4peptides
spectra
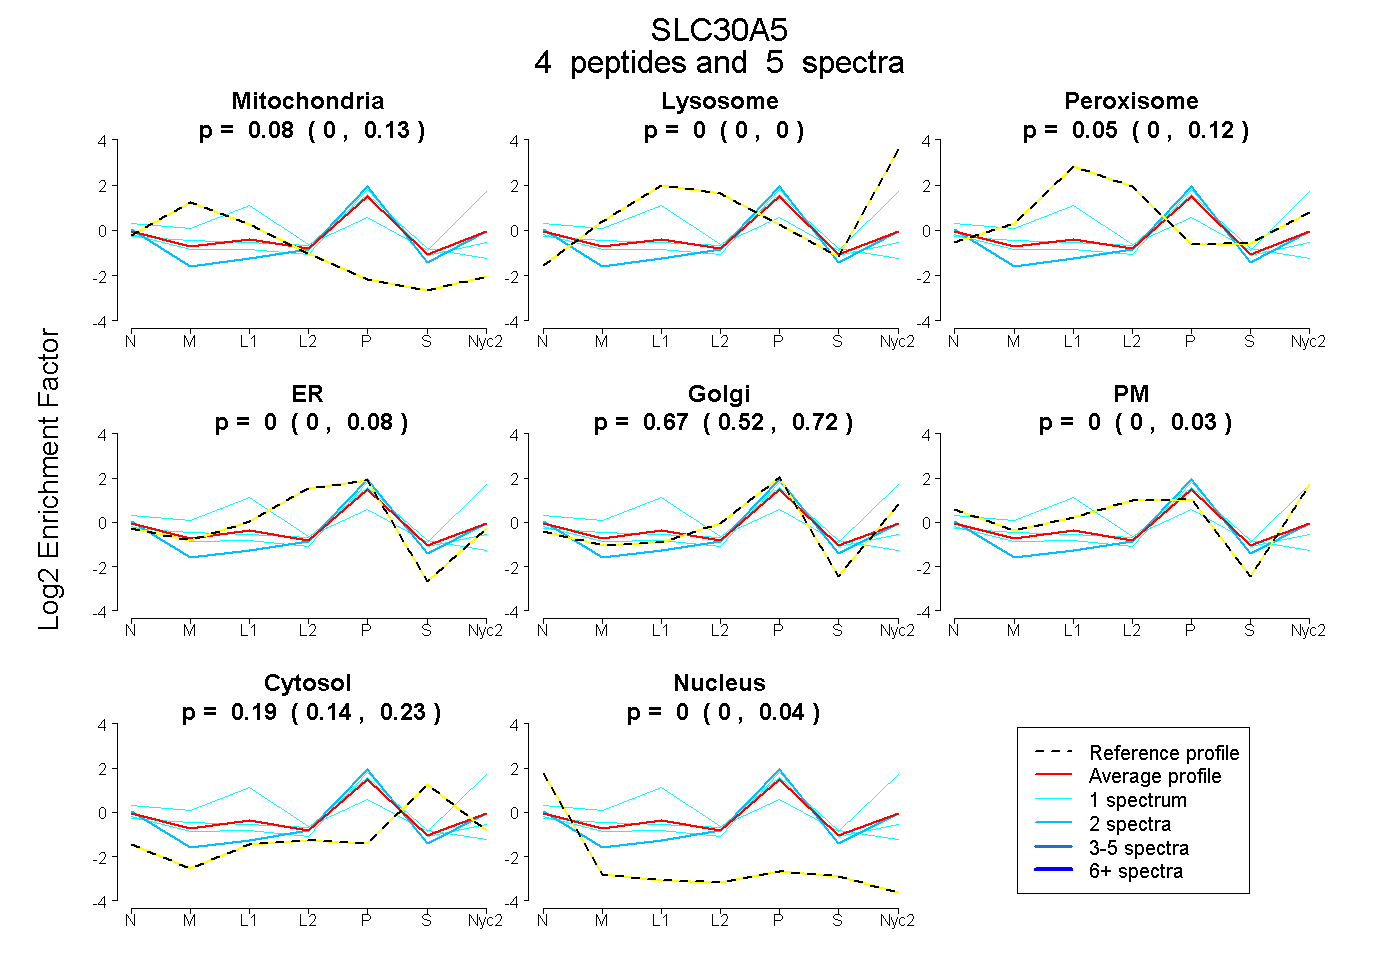
0.000 | 0.134
0.000 | 0.000
0.000 | 0.124
0.000 | 0.080
0.522 | 0.722
0.000 | 0.032
0.145 | 0.229
0.000 | 0.037
3peptides
spectra
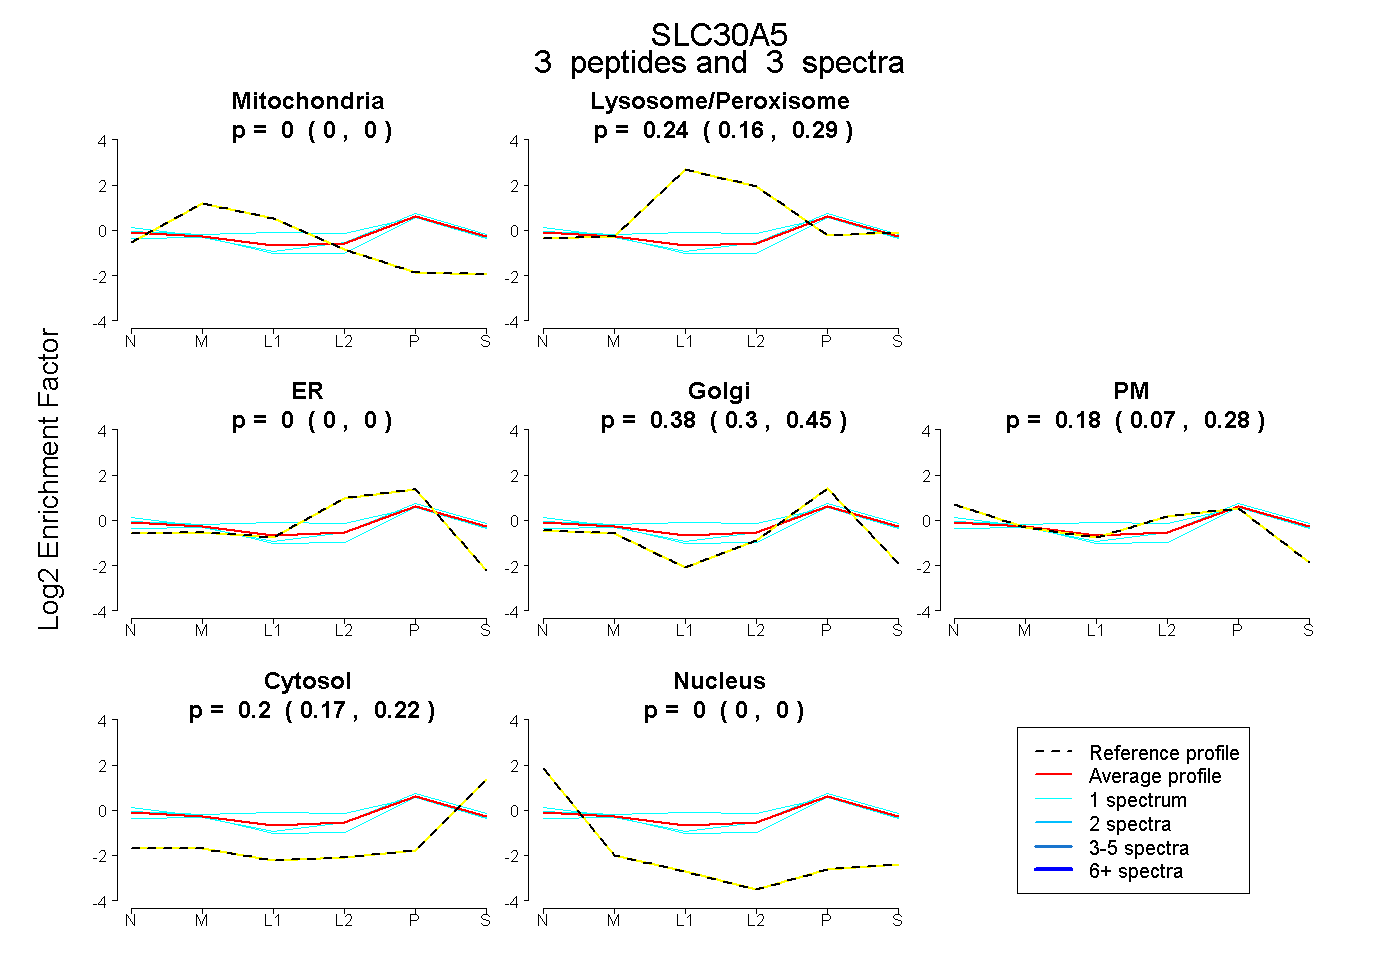
0.000 | 0.000
0.164 | 0.293
0.000 | 0.000
0.305 | 0.447
0.074 | 0.281
0.168 | 0.224
0.000 | 0.000
3peptides
spectra

0.000 | 0.000
1.000 | 1.000