 4
4peptides
spectra
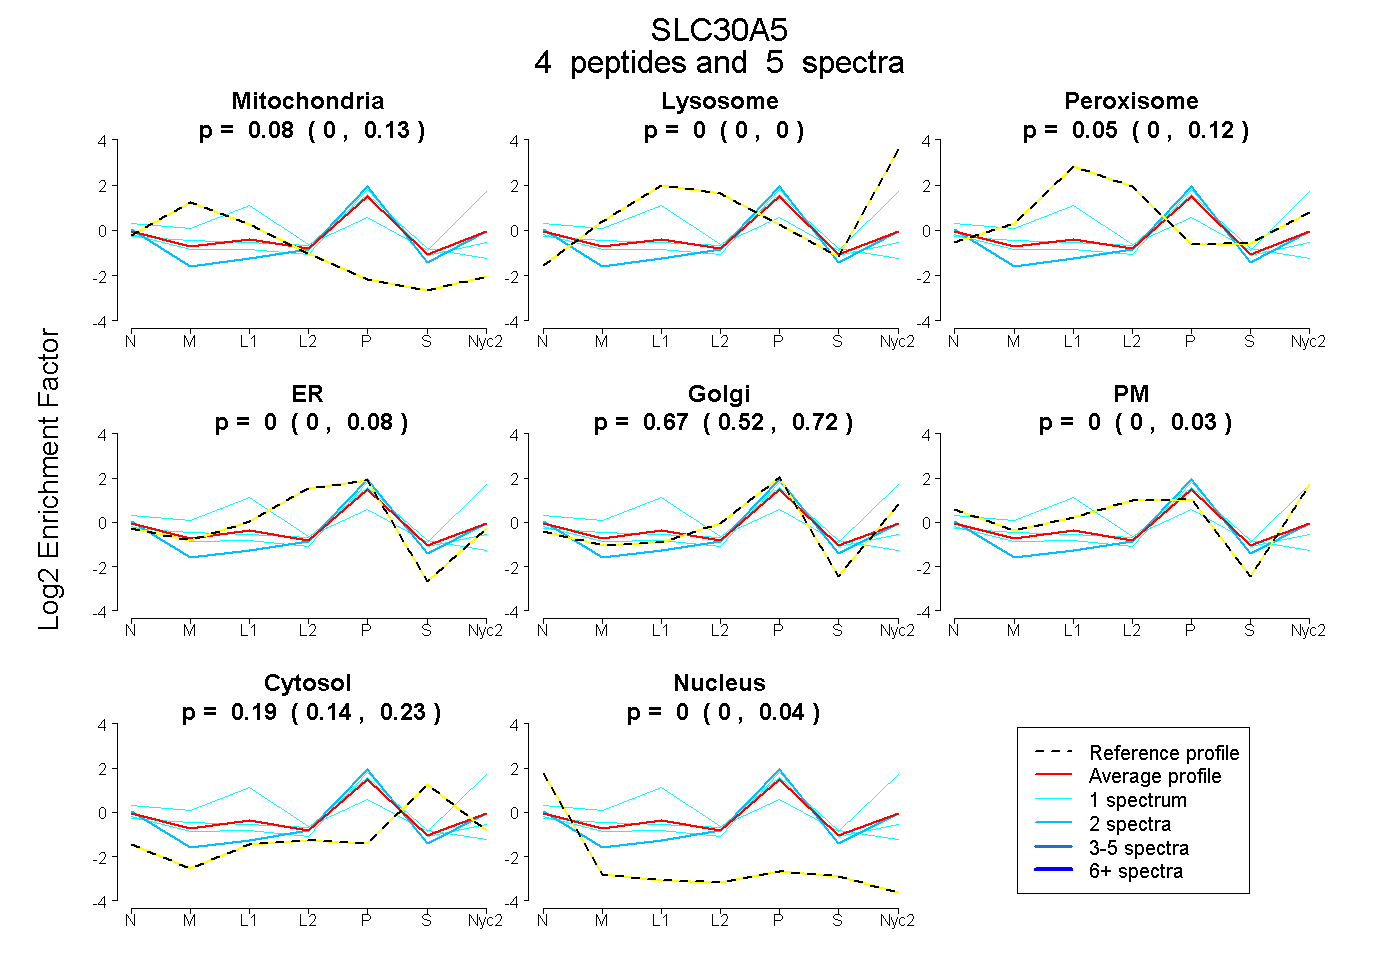
0.000 | 0.134
0.000 | 0.000
0.000 | 0.124
0.000 | 0.080
0.522 | 0.722
0.000 | 0.032
0.145 | 0.229
0.000 | 0.037
| Plot | Mito | Lyso | Perox | ER | Golgi | PM | Cytosol | Nucleus | |||||
| Expt A |
4 peptides |
5 spectra |
|
0.083 0.000 | 0.134 |
0.000 0.000 | 0.000 |
0.055 0.000 | 0.124 |
0.000 0.000 | 0.080 |
0.670 0.522 | 0.722 |
0.000 0.000 | 0.032 |
0.192 0.145 | 0.229 |
0.000 0.000 | 0.037 |
| 1 spectrum, DAGVNNLTIQVEK | 0.100 | 0.281 | 0.017 | 0.000 | 0.000 | 0.450 | 0.152 | 0.000 | ||
| 1 spectrum, DACQVLLLR | 0.139 | 0.000 | 0.000 | 0.263 | 0.332 | 0.000 | 0.261 | 0.005 | ||
| 1 spectrum, AVGLFESYDLLK | 0.051 | 0.000 | 0.000 | 0.000 | 0.704 | 0.000 | 0.204 | 0.040 | ||
| 2 spectra, QILEESDSR | 0.000 | 0.000 | 0.000 | 0.000 | 0.774 | 0.000 | 0.149 | 0.077 |
| Plot | Mito | Lyso or Perox | ER | Golgi | PM | Cytosol | Nucleus | ||||||
| Expt B |
3 peptides |
3 spectra |
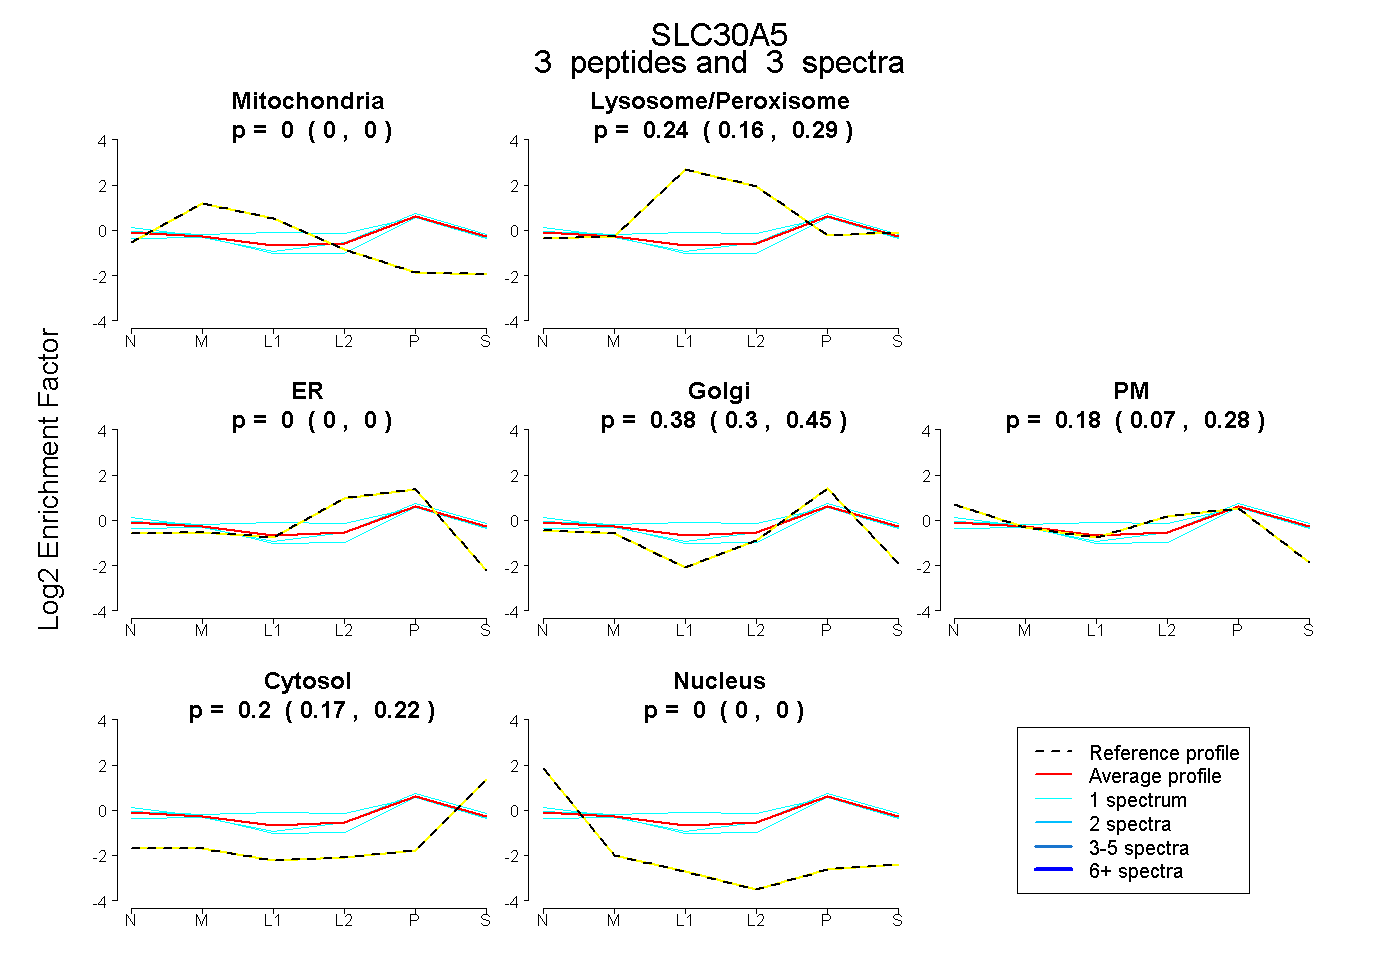 |
0.000 0.000 | 0.000 |
0.235 0.164 | 0.293 |
0.000 0.000 | 0.000 |
0.382 0.305 | 0.447 |
0.185 0.074 | 0.281 |
0.198 0.168 | 0.224 |
0.000 0.000 | 0.000 |
|||
| Plot | Lyso | Other | |||||||||||
| Expt C |
3 peptides |
7 spectra |
 |
0.000 0.000 | 0.000 |
1.000 1.000 | 1.000 |