 7
7peptides
spectra
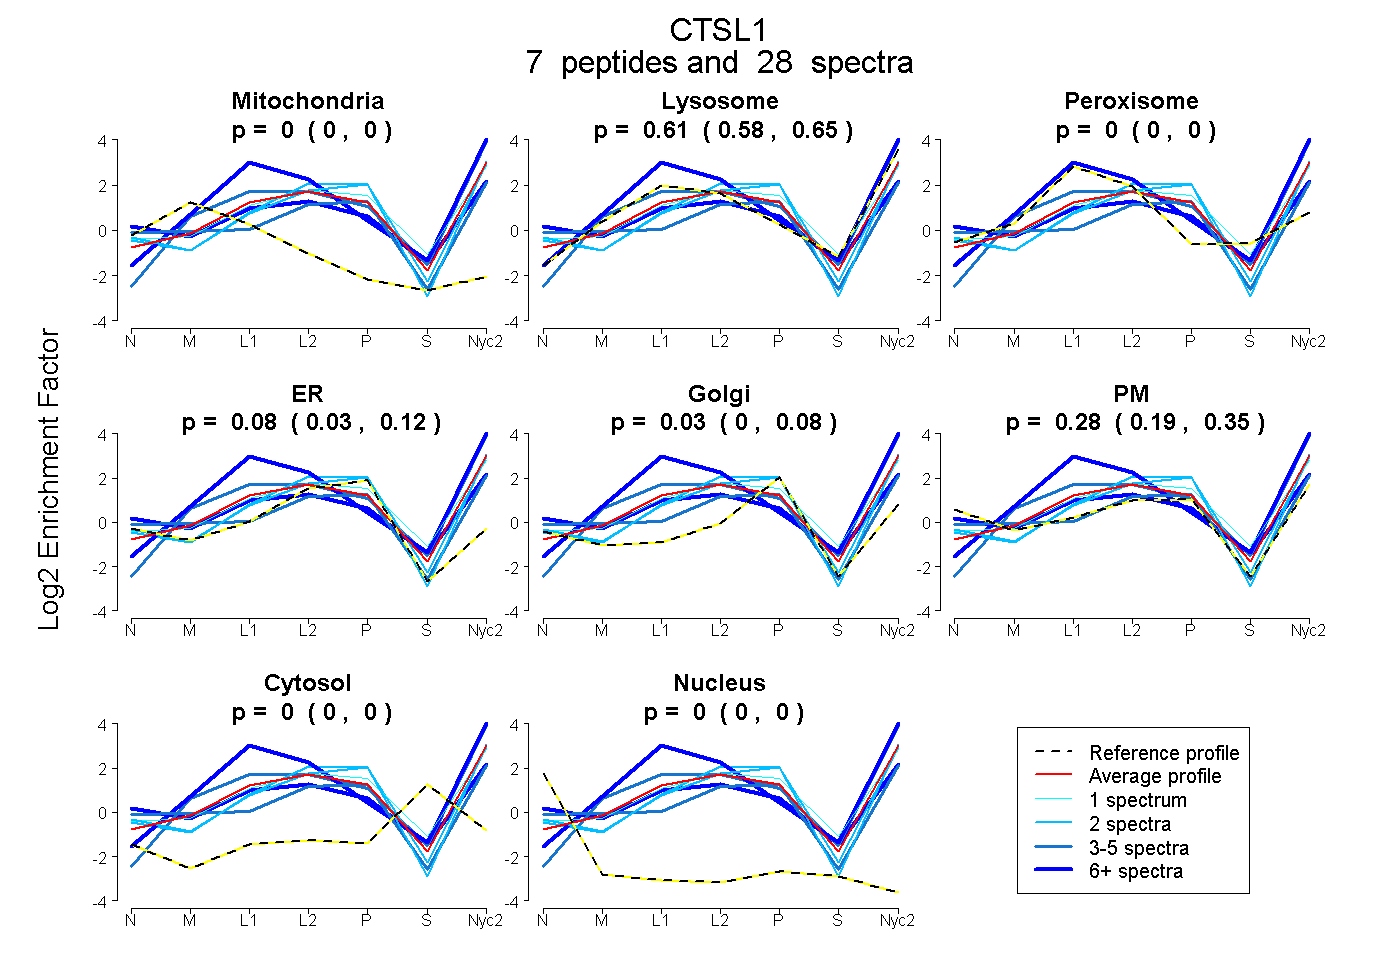
0.000 | 0.000
0.576 | 0.645
0.000 | 0.000
0.029 | 0.125
0.000 | 0.077
0.189 | 0.350
0.000 | 0.000
0.000 | 0.000
1peptide
spectrum
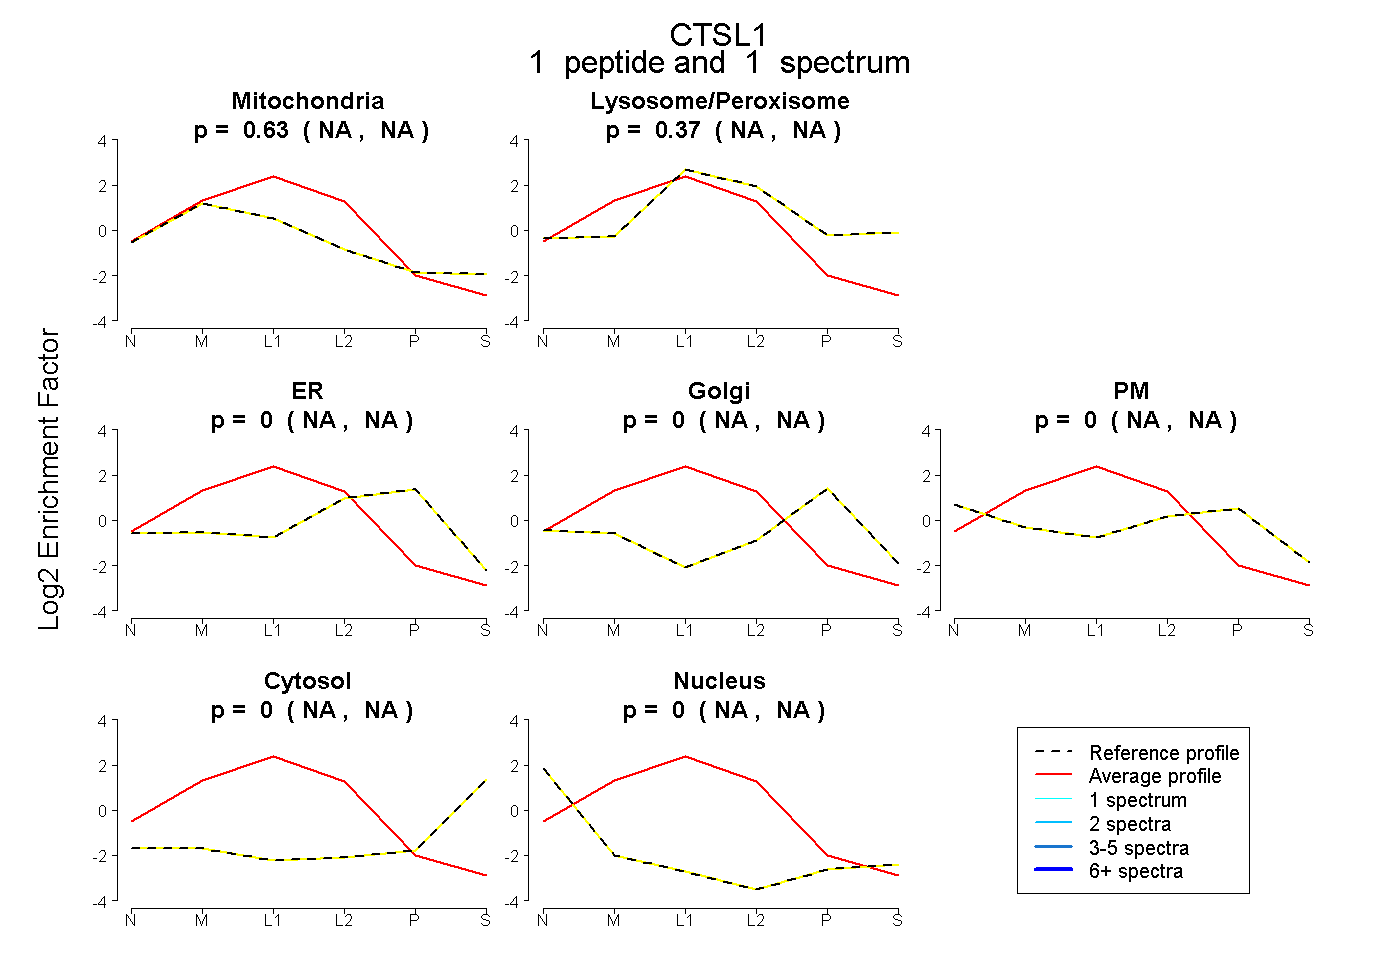
NA | NA
NA | NA
NA | NA
NA | NA
NA | NA
NA | NA
NA | NA
7peptides
spectra
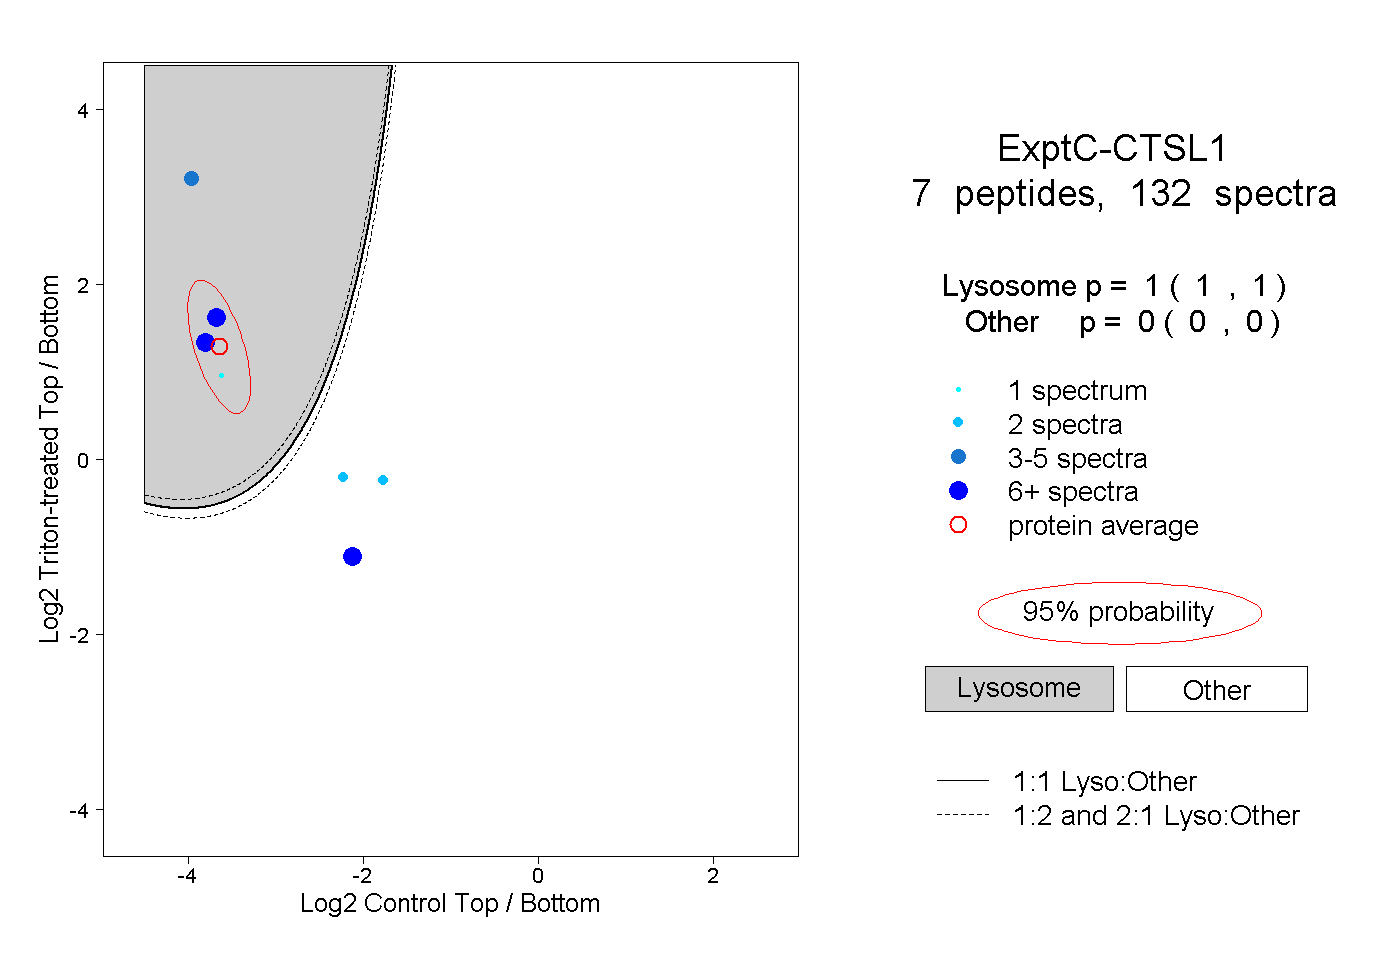
1.000 | 1.000
0.000 | 0.000
2peptides
spectra
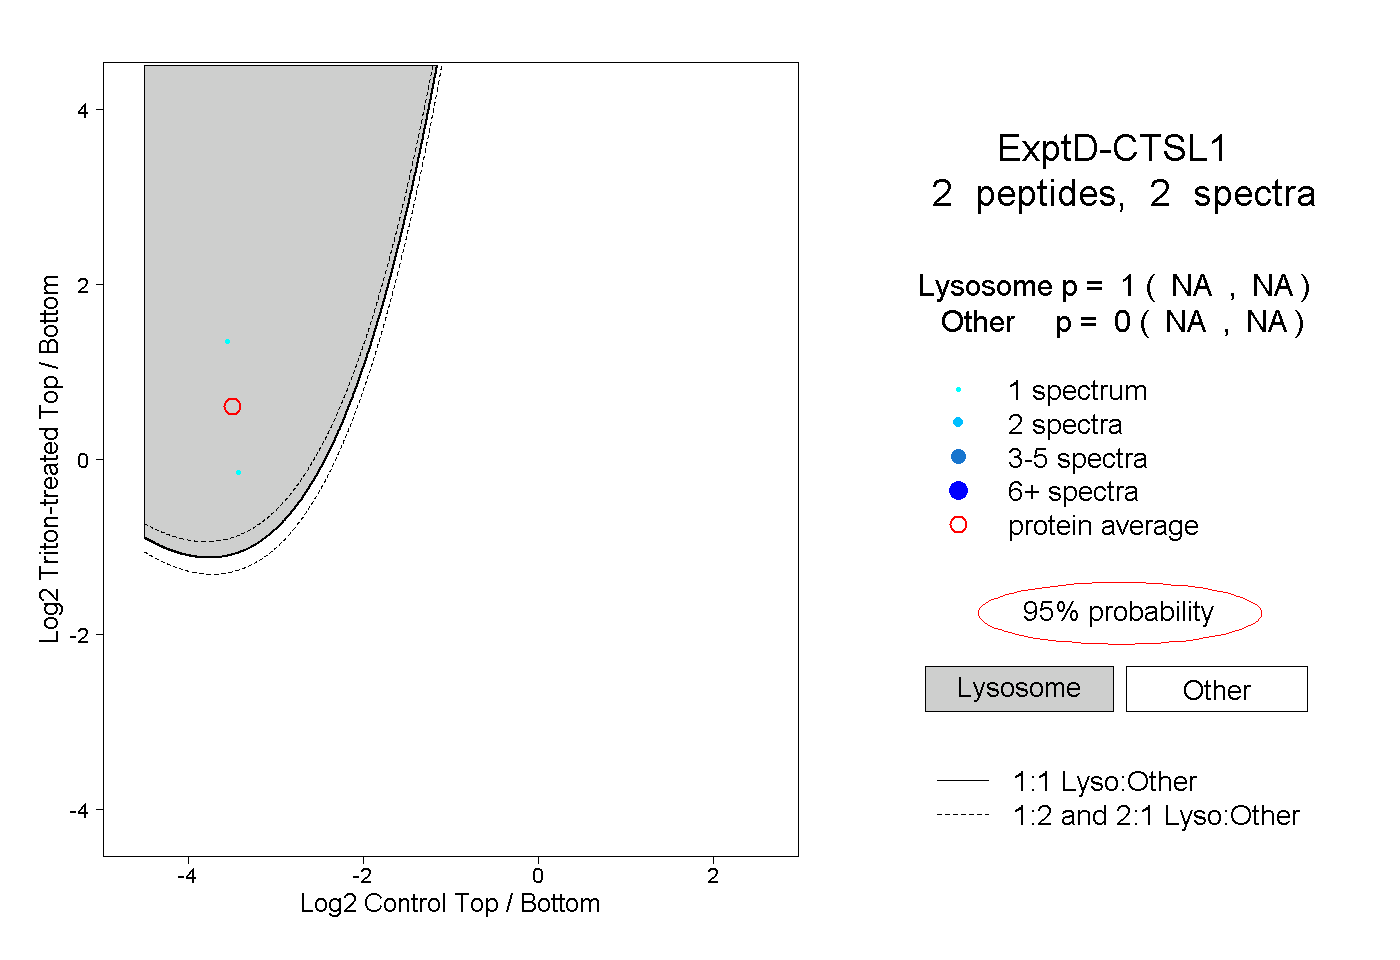
NA | NA
NA | NA