 7
7peptides
spectra
0.000 | 0.000
0.576 | 0.645
0.000 | 0.000
0.029 | 0.125
0.000 | 0.077
0.189 | 0.350
0.000 | 0.000
0.000 | 0.000
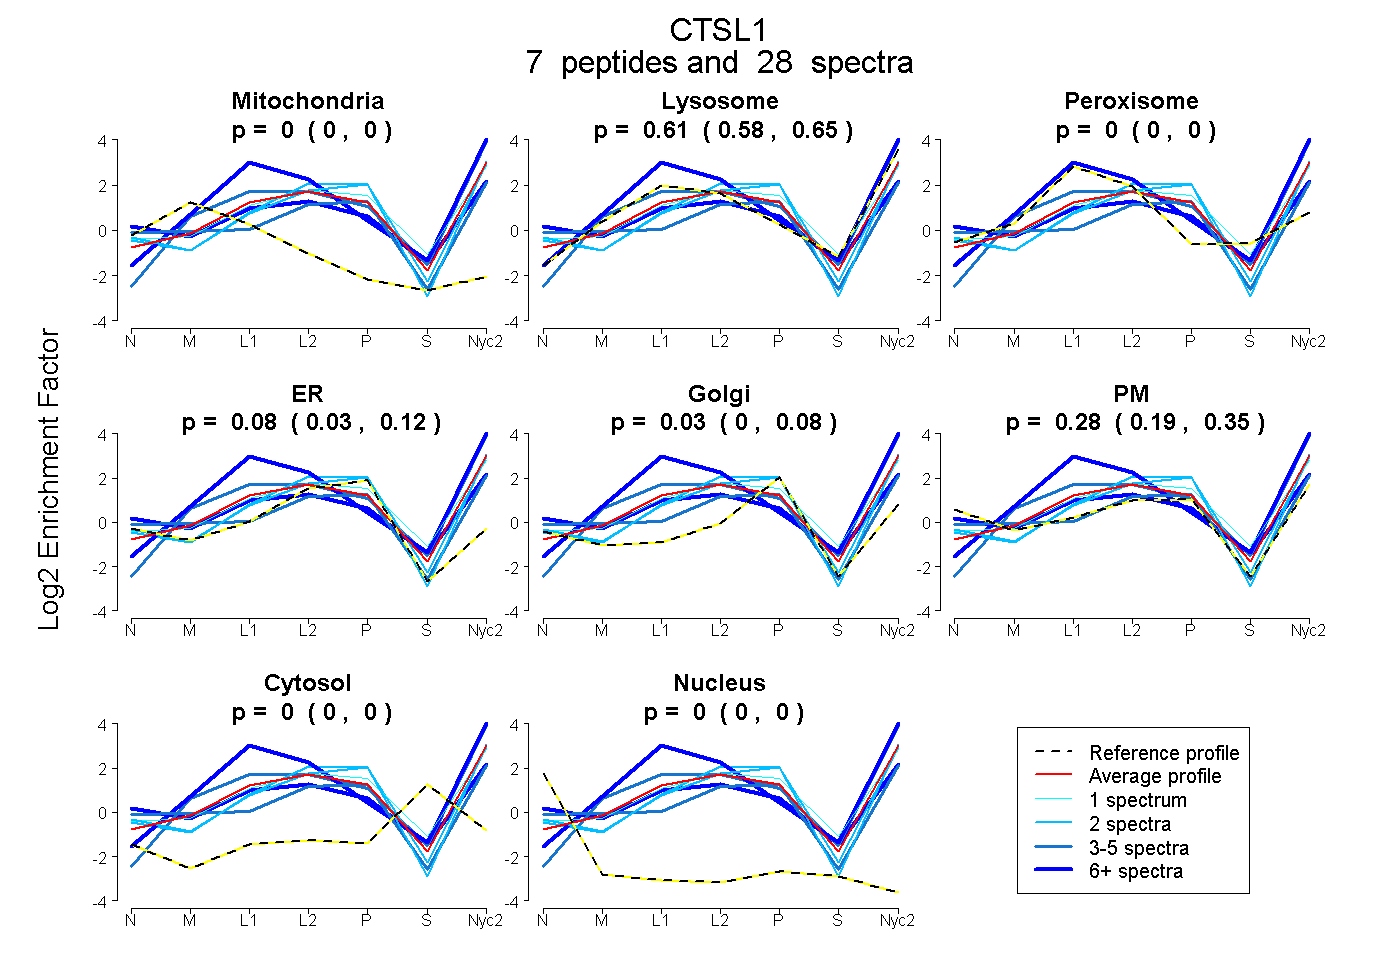
| Plot | Mito | Lyso | Perox | ER | Golgi | PM | Cytosol | Nucleus | |||||
| Expt A |
7 peptides |
28 spectra |
|
0.000 0.000 | 0.000 |
0.613 0.576 | 0.645 |
0.000 0.000 | 0.000 |
0.083 0.029 | 0.125 |
0.026 0.000 | 0.077 |
0.279 0.189 | 0.350 |
0.000 0.000 | 0.000 |
0.000 0.000 | 0.000 |
| 2 spectra, FDQTFNAQWHQWK | 0.000 | 0.418 | 0.000 | 0.186 | 0.046 | 0.349 | 0.000 | 0.000 | ||
| 6 spectra, ENGGLDSEESYPYEAK | 0.000 | 0.248 | 0.135 | 0.000 | 0.000 | 0.591 | 0.026 | 0.000 | ||
| 5 spectra, HGFTMEMNAFGDMTNEEFR | 0.000 | 0.170 | 0.000 | 0.000 | 0.160 | 0.671 | 0.000 | 0.000 | ||
| 8 spectra, GCVTPVK | 0.000 | 1.000 | 0.000 | 0.000 | 0.000 | 0.000 | 0.000 | 0.000 | ||
| 4 spectra, EWGMDGYIK | 0.000 | 0.996 | 0.000 | 0.000 | 0.004 | 0.000 | 0.000 | 0.000 | ||
| 1 spectrum, LFQEPLMLQIPK | 0.000 | 0.572 | 0.000 | 0.102 | 0.046 | 0.281 | 0.000 | 0.000 | ||
| 2 spectra, LYGTNEEEWR | 0.000 | 0.314 | 0.000 | 0.047 | 0.078 | 0.561 | 0.000 | 0.000 |
| Plot | Mito | Lyso or Perox | ER | Golgi | PM | Cytosol | Nucleus | ||||||
| Expt B |
1 peptide |
1 spectrum |
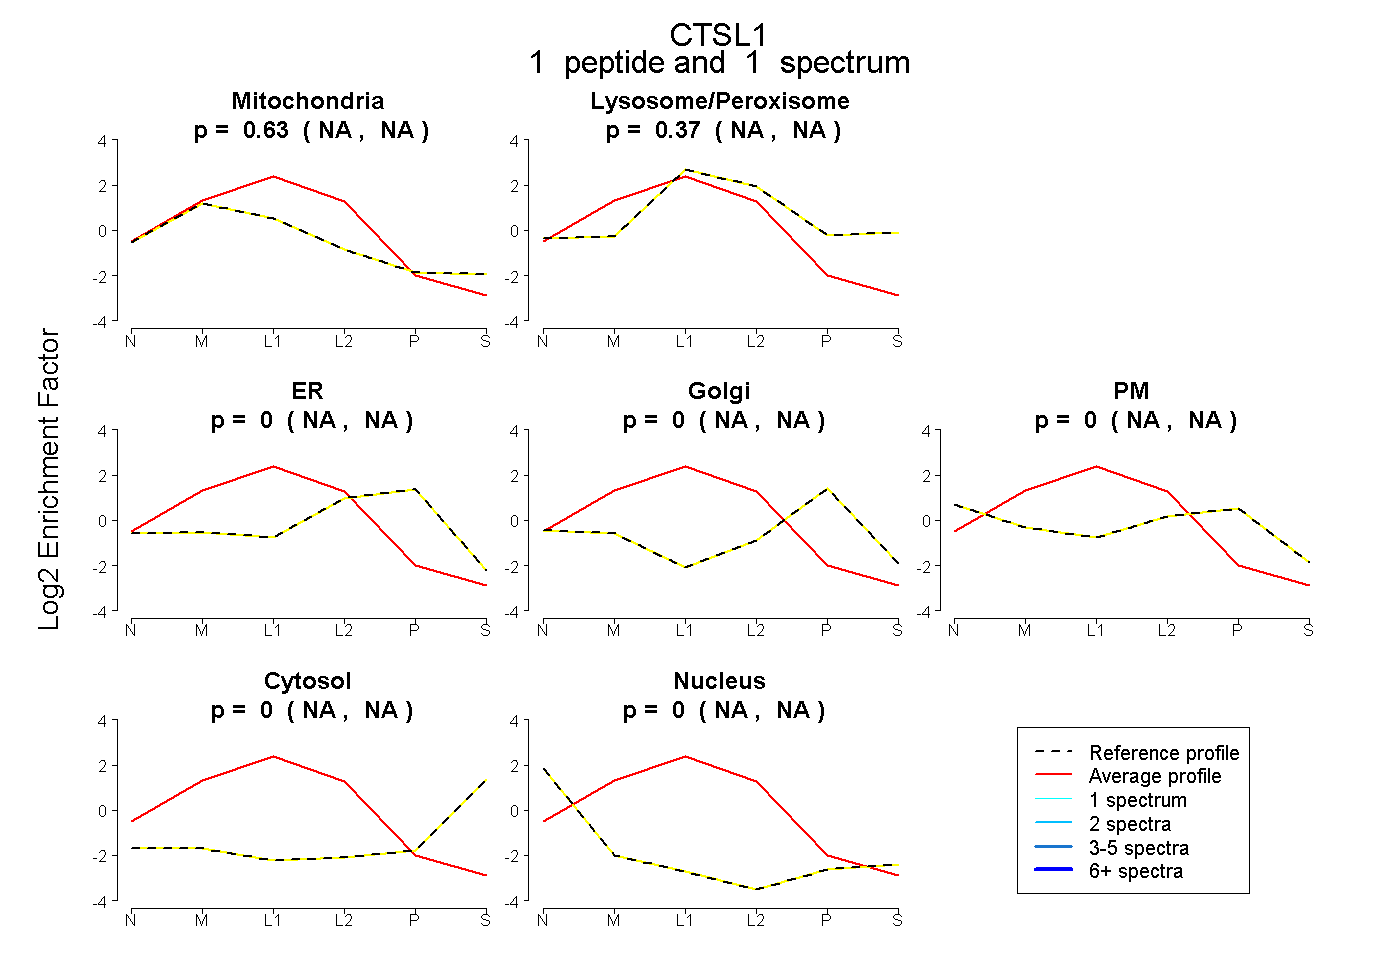 |
0.629 NA | NA |
0.371 NA | NA |
0.000 NA | NA |
0.000 NA | NA |
0.000 NA | NA |
0.000 NA | NA |
0.000 NA | NA |
|||
| Plot | Lyso | Other | |||||||||||
| Expt C |
7 peptides |
132 spectra |
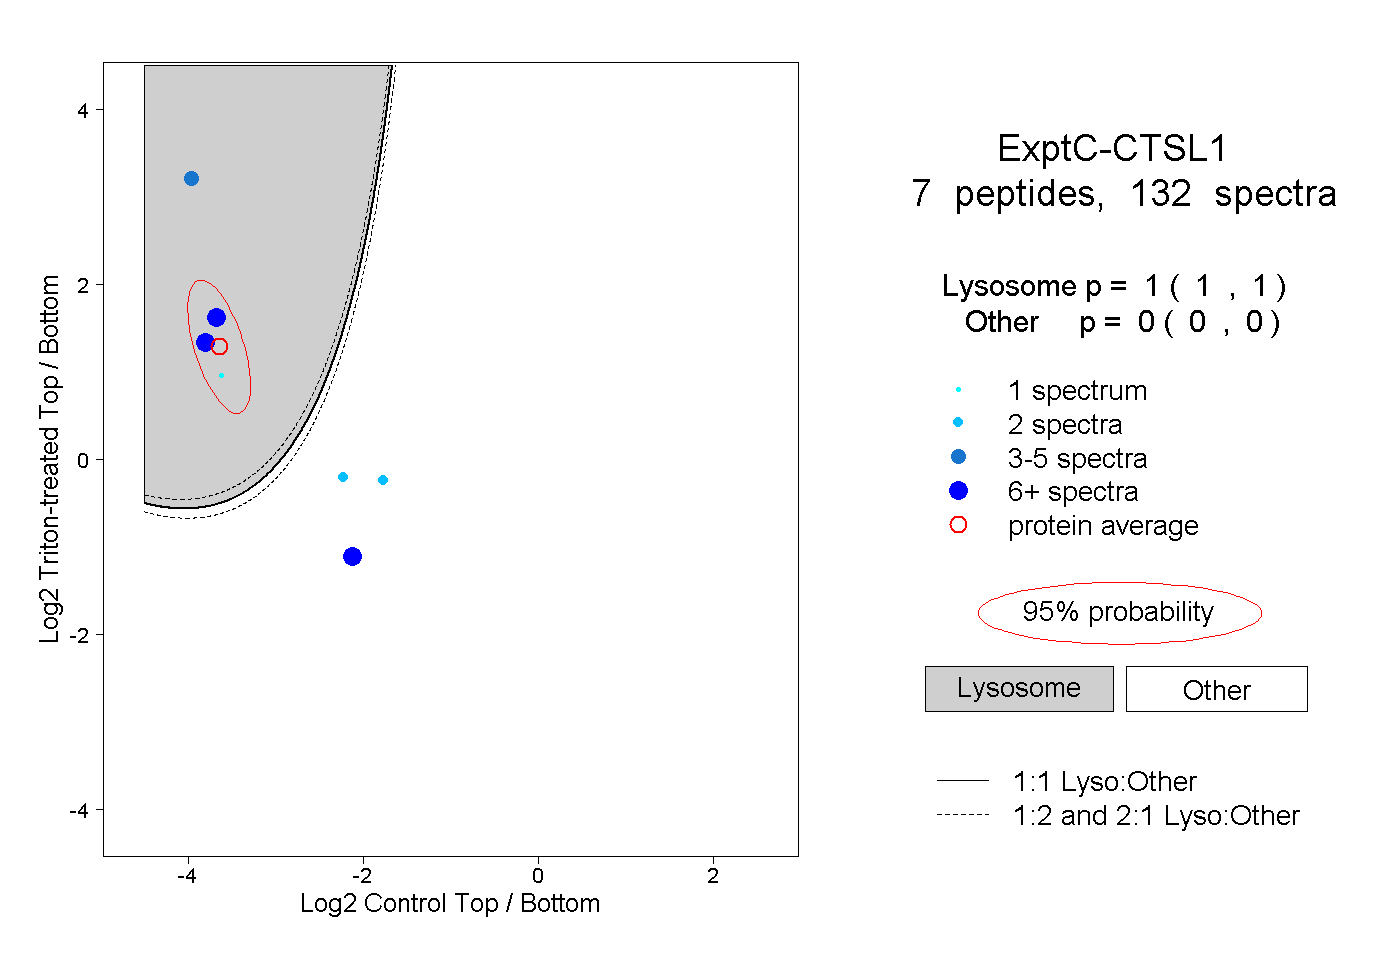 |
1.000 1.000 | 1.000 |
0.000 0.000 | 0.000 |
||||||||
| Plot | Lyso | Other | |||||||||||
| Expt D |
2 peptides |
2 spectra |
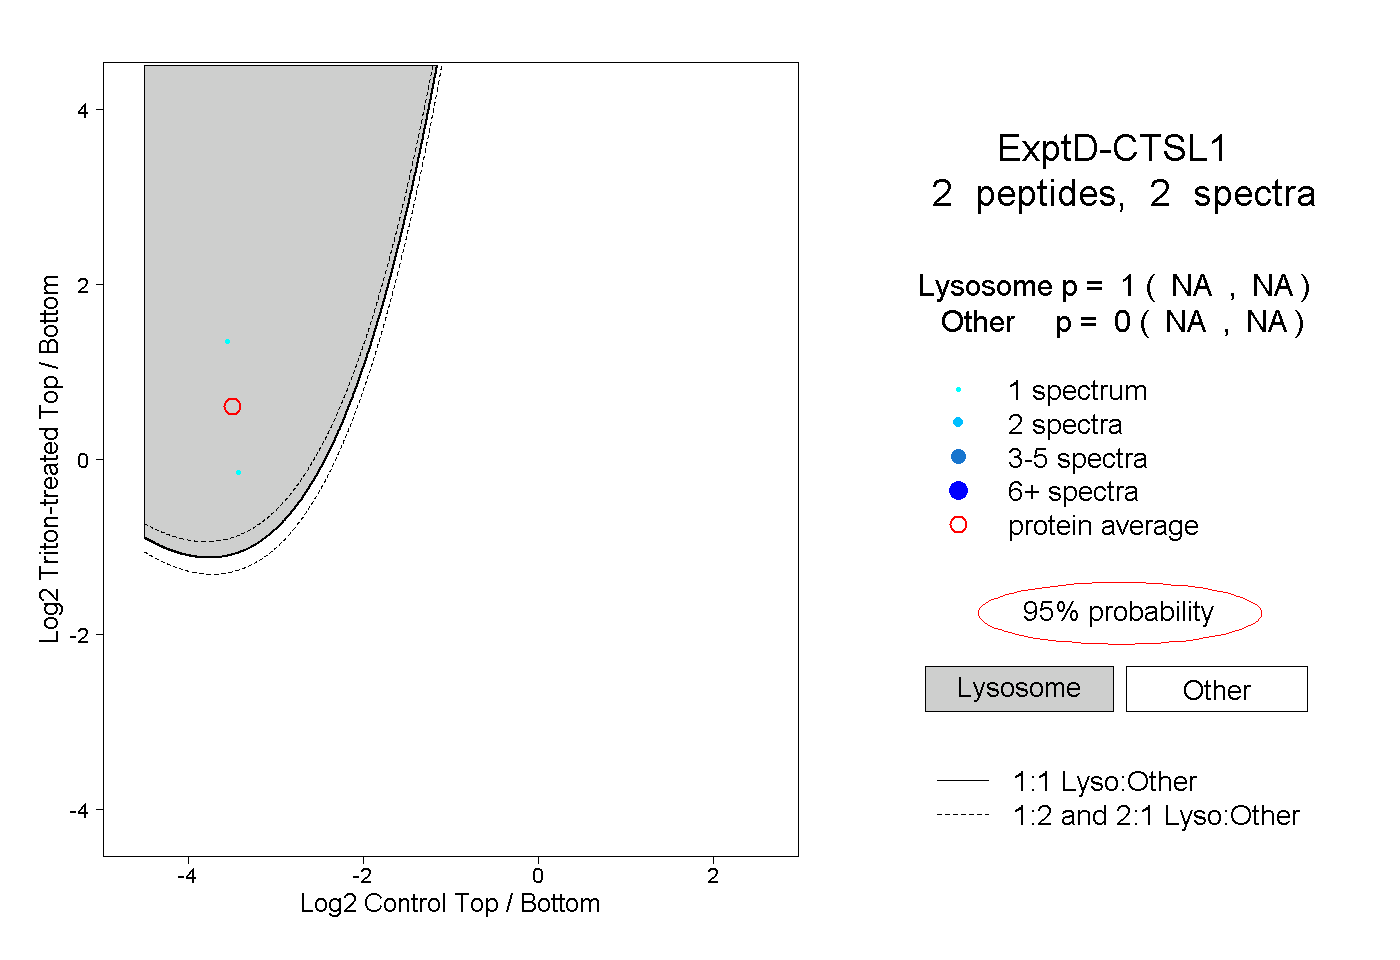 |
1.000 NA | NA |
0.000 NA | NA |