 11
11peptides
spectra
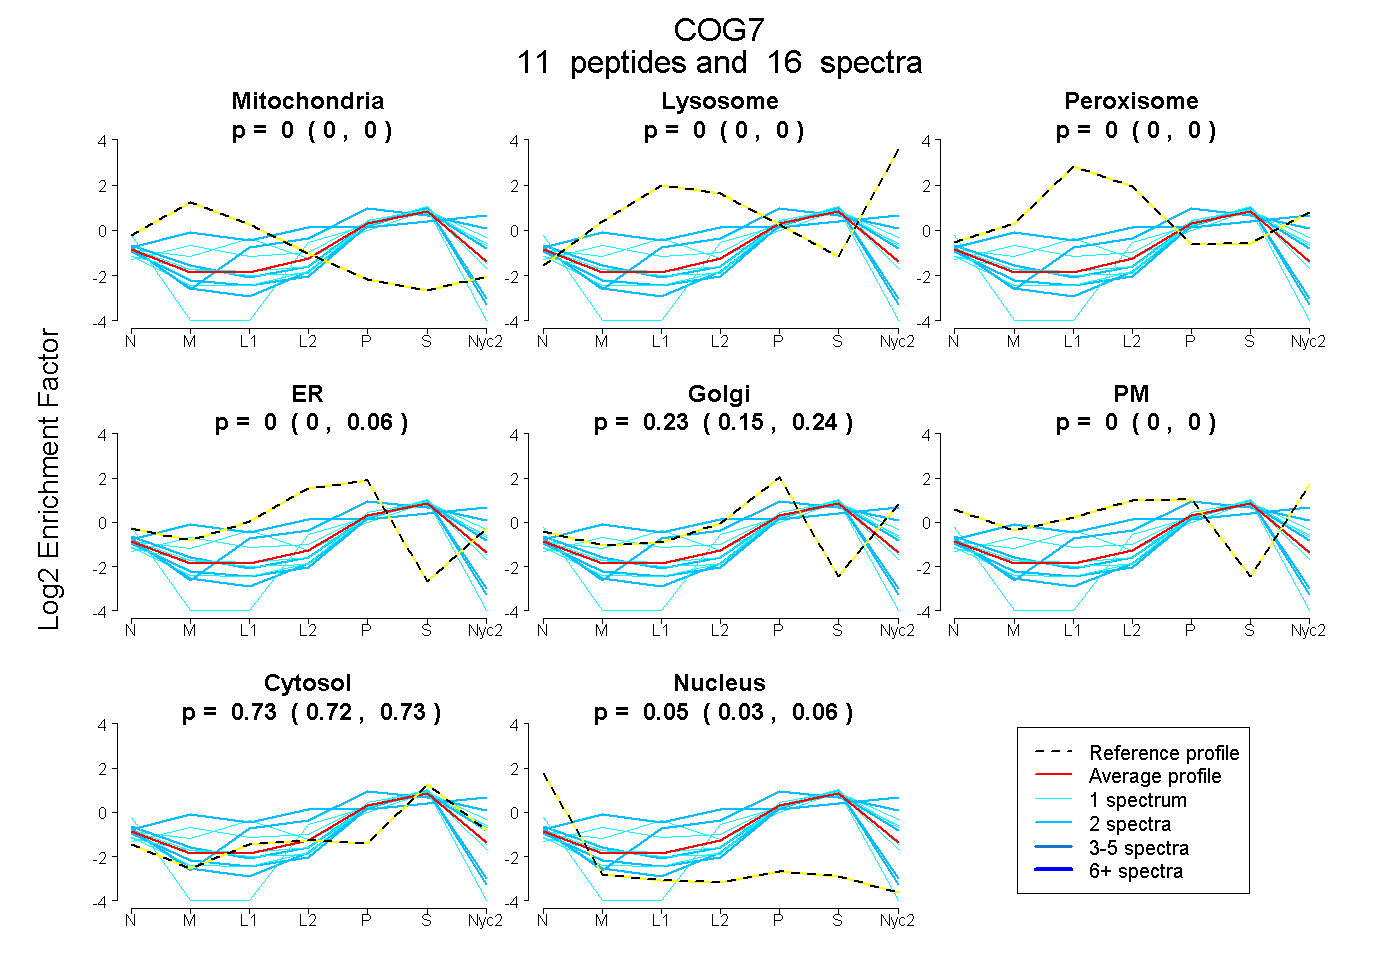
0.000 | 0.000
0.000 | 0.000
0.000 | 0.000
0.000 | 0.057
0.147 | 0.243
0.000 | 0.000
0.716 | 0.734
0.027 | 0.061
3peptides
spectra
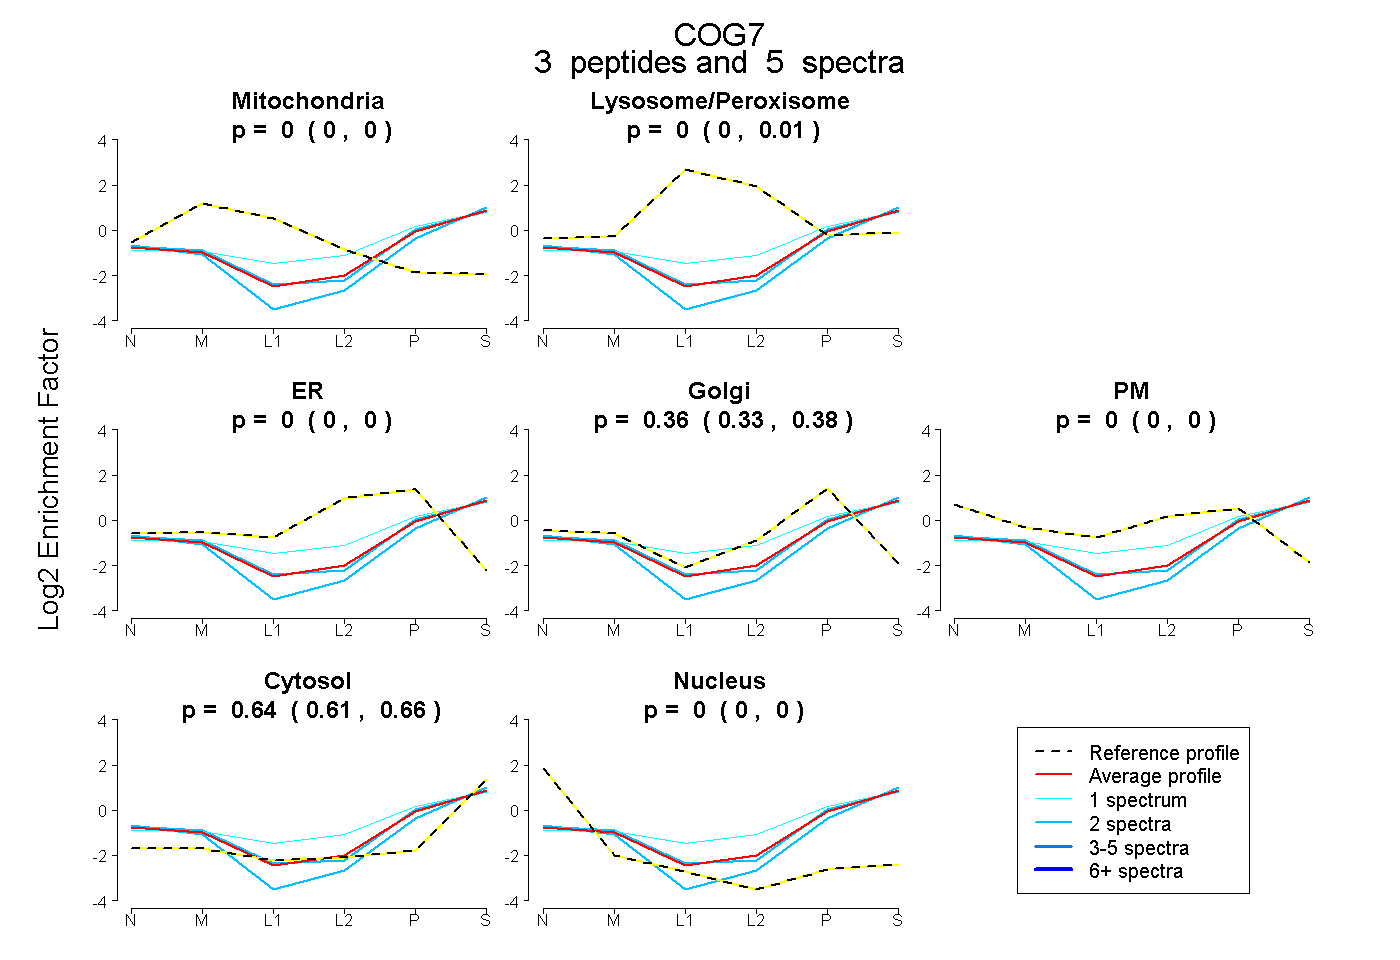
0.000 | 0.000
0.000 | 0.009
0.000 | 0.000
0.325 | 0.380
0.000 | 0.000
0.611 | 0.662
0.000 | 0.000
6peptides
spectra
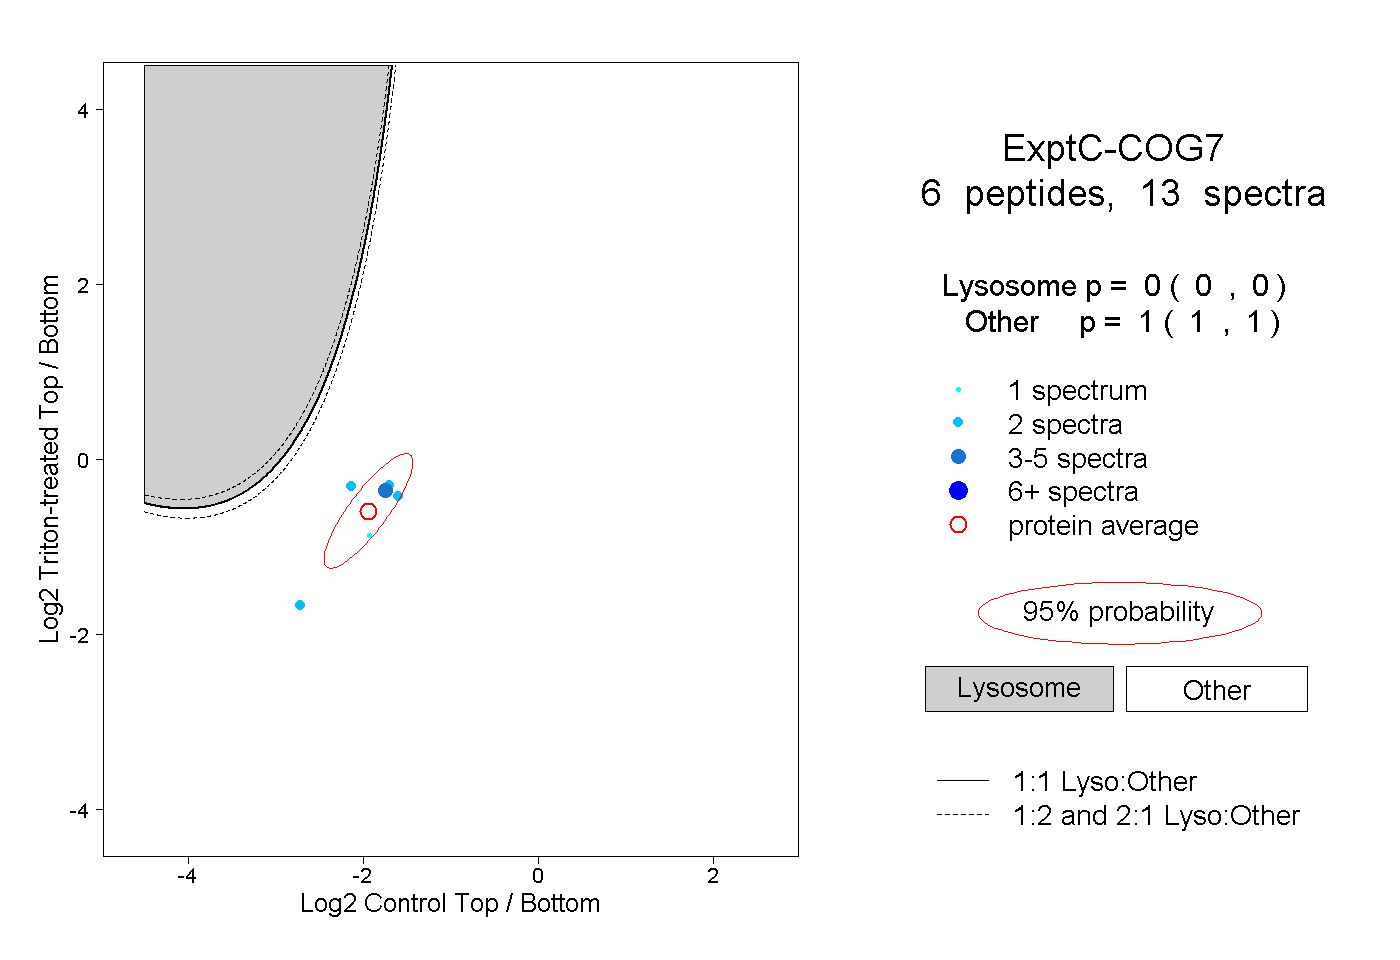
0.000 | 0.000
1.000 | 1.000